| Param | Original file | Final file |
|---|---|---|
| Filename | modeM0/AS1A05_204T01_9000002856cztM0_level2_bc.evt | modeM0/AS1A05_204T01_9000002856cztM0_level2_quad_clean.evt |
| Size (bytes) | 14,454,097,920 | 4,441,268,160 |
| Size | 13.5 GB | 4.1 GB |
| Events in quadrant A | 71,945,461 | 29,195,967 |
| Events in quadrant B | 73,866,554 | 29,376,026 |
| Events in quadrant C | 70,393,694 | 28,057,762 |
| Events in quadrant D | 198,849,046 | 25,048,023 |
| Mode M0 | |||
|---|---|---|---|
| Quadrant | BADHDUFLAG | Total packets | Discarded packets |
| A | 0 | 702780 | 0 |
| B | 0 | 707182 | 0 |
| C | 0 | 705411 | 0 |
| D | 0 | 1228885 | 0 |
| Mode M9 | |||
|---|---|---|---|
| Quadrant | BADHDUFLAG | Total packets | Discarded packets |
| A | 0 | 507 | 0 |
| B | 0 | 507 | 0 |
| C | 0 | 507 | 0 |
| D | 0 | 507 | 0 |
| Mode SS | |||
|---|---|---|---|
| Quadrant | BADHDUFLAG | Total packets | Discarded packets |
| A | 0 | 6786 | 0 |
| B | 0 | 6786 | 0 |
| C | 0 | 6786 | 0 |
| D | 0 | 6786 | 0 |
| Quadrant | Total seconds | Saturated seconds | Saturation percentage |
|---|---|---|---|
| A | 333469 | 3989 | 1.196213% |
| B | 333471 | 4202 | 1.260080% |
| C | 333471 | 5112 | 1.532967% |
| D | 333470 | 56277 | 16.876181% |
Noise dominated data is calculated using 1-second bins in cleaned event files. If a bin has >2000 counts, and if more than 50% of those come from <1% of pixels, then it is considered to be noise-dominated and hence unusable.
| Quadrant | # 1 sec bins | Bins with >0 counts | Bins with >2000 counts | High rate bins dominated by noise | Noise dominated (total time) | Noise dominated (detector-on time) | Marked lightcurve |
|---|---|---|---|---|---|---|---|
| A | 383792 | 333444 | 94 | 94 | 0.02% | 0.03% |  |
| B | 383792 | 333441 | 101 | 101 | 0.03% | 0.03% |  |
| C | 383792 | 333446 | 12 | 12 | 0.00% | 0.00% |  |
| D | 383792 | 333418 | 7590 | 7590 | 1.98% | 2.28% |  |
Top three noisy pixels from each quadrant. If the there are fewer than three noisy pixels in the level2.evt file, extra rows are filled as -1
| Pixel properties | Quadrant properties | ||||||
|---|---|---|---|---|---|---|---|
| Quadrant | DetID | PixID | Counts | Sigma | Mean | Median | Sigma |
| A | 11 | 29 | 1072738 | 275.63 | 17829 | 17508 | 3828.4 |
| A | 4 | 2 | 785848 | 200.69 | 17829 | 17508 | 3828.4 |
| A | 5 | 16 | 639608 | 162.5 | 17829 | 17508 | 3828.4 |
| B | 0 | 229 | 1528426 | 452.99 | 17857 | 17422 | 3335.7 |
| B | 3 | 64 | 869493 | 255.44 | 17857 | 17422 | 3335.7 |
| B | 0 | 190 | 824244 | 241.88 | 17857 | 17422 | 3335.7 |
| C | 3 | 233 | 3898709 | 968.08 | 17105 | 17008 | 4009.7 |
| C | 9 | 54 | 206224 | 47.19 | 17105 | 17008 | 4009.7 |
| C | 0 | 207 | 130077 | 28.2 | 17105 | 17008 | 4009.7 |
| D | 7 | 238 | 52440769 | 13904.92 | 16268 | 15684 | 3770.3 |
| D | 10 | 66 | 37445859 | 9927.76 | 16268 | 15684 | 3770.3 |
| D | 1 | 52 | 27024325 | 7163.61 | 16268 | 15684 | 3770.3 |
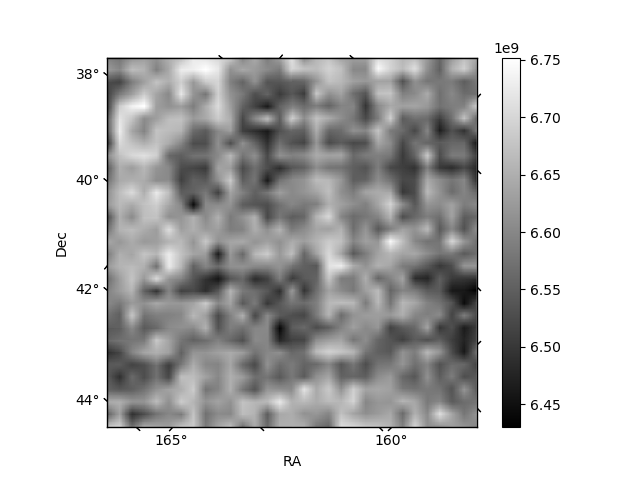
Histogram calculated using DETX and DETY for each event in the final _common_clean file
| Quadrant A |  |
 |
Quadrant B |
|---|---|---|---|
| Quadrant D |  |
 |
Quadrant C |
| Plot type | Count rate plots | Images |
|---|---|---|
| Comparison with Poisson distribution Blue bars denote a histogram of data divided into 1 sec bins. Red curve is a Poisson curve with rate = median count rate of data. |
 |
 |
| Quadrant-wise count rates Data is divided into 100 sec bins |
 |
|
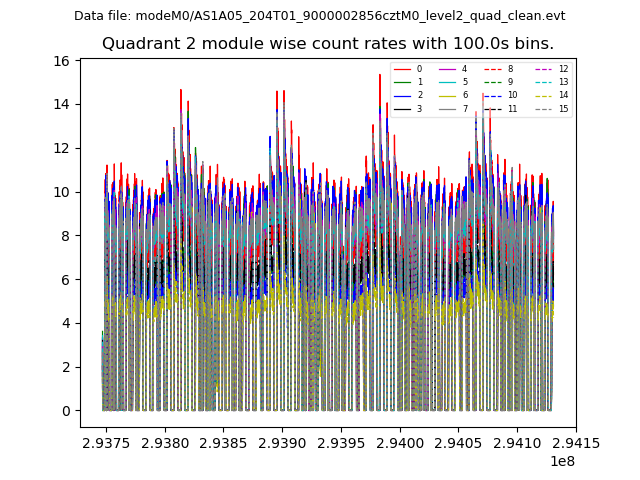
| Module-wise count rates for Quadrant A Data is divided into 100 sec bins |
 |
 |
| Module-wise count rates for Quadrant B Data is divided into 100 sec bins |
 |
 |
| Module-wise count rates for Quadrant C Data is divided into 100 sec bins |
 |
 |
| Module-wise count rates for Quadrant D Data is divided into 100 sec bins |
 |
 |
| Parameter | Plot |
|---|---|
| CZT HV Monitor |  |
| D_VDD |  |
| Temperature 1 |  |
| Veto HV Monitor |  |
| Veto LLD |  |
| Alpha Counter |  |
| _CPM_Rate |  |
| CZT Counter |  |
| +2.5 Volts monitor |  |
| +5 Volts monitor | 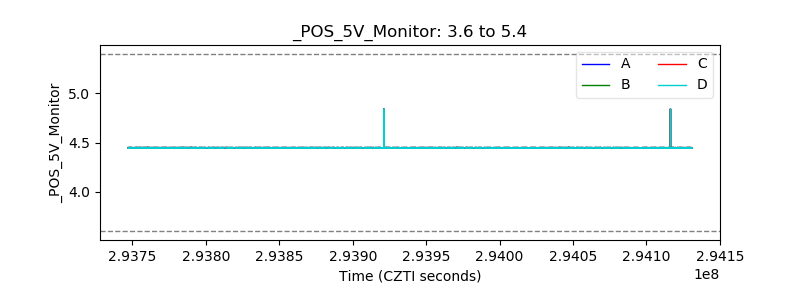 |
| _ROLL_ROT |  |
| _Roll_DEC |  |
| _Roll_RA |  |
| Veto Counter |  |