| Param | Original file | Final file |
|---|---|---|
| Filename | modeM0/AS1A05_107T01_9000002852cztM0_level2_bc.evt | modeM0/AS1A05_107T01_9000002852cztM0_level2_quad_clean.evt |
| Size (bytes) | 3,366,115,200 | 1,318,861,440 |
| Size | 3.1 GB | 1.2 GB |
| Events in quadrant A | 20,787,994 | 8,334,440 |
| Events in quadrant B | 21,275,519 | 8,521,567 |
| Events in quadrant C | 20,869,770 | 8,349,894 |
| Events in quadrant D | 32,348,404 | 8,042,299 |
| Mode M0 | |||
|---|---|---|---|
| Quadrant | BADHDUFLAG | Total packets | Discarded packets |
| A | 0 | 205761 | 0 |
| B | 0 | 207314 | 0 |
| C | 0 | 207696 | 0 |
| D | 0 | 246396 | 0 |
| Mode SS | |||
|---|---|---|---|
| Quadrant | BADHDUFLAG | Total packets | Discarded packets |
| A | 0 | 1986 | 0 |
| B | 0 | 1986 | 0 |
| C | 0 | 1986 | 0 |
| D | 0 | 1986 | 0 |
| Mode M9 | |||
|---|---|---|---|
| Quadrant | BADHDUFLAG | Total packets | Discarded packets |
| A | 0 | 129 | 0 |
| B | 0 | 129 | 0 |
| C | 0 | 129 | 0 |
| D | 0 | 129 | 0 |
| Quadrant | Total seconds | Saturated seconds | Saturation percentage |
|---|---|---|---|
| A | 97766 | 1180 | 1.206964% |
| B | 97766 | 1495 | 1.529161% |
| C | 97766 | 1873 | 1.915799% |
| D | 97766 | 3876 | 3.964568% |
Noise dominated data is calculated using 1-second bins in cleaned event files. If a bin has >2000 counts, and if more than 50% of those come from <1% of pixels, then it is considered to be noise-dominated and hence unusable.
| Quadrant | # 1 sec bins | Bins with >0 counts | Bins with >2000 counts | High rate bins dominated by noise | Noise dominated (total time) | Noise dominated (detector-on time) | Marked lightcurve |
|---|---|---|---|---|---|---|---|
| A | 110546 | 97762 | 11 | 11 | 0.01% | 0.01% |  |
| B | 110546 | 97761 | 15 | 15 | 0.01% | 0.02% |  |
| C | 110546 | 97759 | 4 | 4 | 0.00% | 0.00% |  |
| D | 110546 | 97761 | 598 | 598 | 0.54% | 0.61% |  |
Top three noisy pixels from each quadrant. If the there are fewer than three noisy pixels in the level2.evt file, extra rows are filled as -1
| Pixel properties | Quadrant properties | ||||||
|---|---|---|---|---|---|---|---|
| Quadrant | DetID | PixID | Counts | Sigma | Mean | Median | Sigma |
| A | 4 | 2 | 264369 | 230.85 | 5213 | 5112 | 1123.0 |
| A | 9 | 143 | 234908 | 204.62 | 5213 | 5112 | 1123.0 |
| A | 13 | 254 | 127660 | 109.12 | 5213 | 5112 | 1123.0 |
| B | 0 | 229 | 297105 | 297.37 | 5291 | 5158 | 981.8 |
| B | 0 | 230 | 190081 | 188.36 | 5291 | 5158 | 981.8 |
| B | 3 | 64 | 140142 | 137.49 | 5291 | 5158 | 981.8 |
| C | 3 | 233 | 895015 | 739.99 | 5139 | 5123 | 1202.6 |
| C | 9 | 54 | 98553 | 77.69 | 5139 | 5123 | 1202.6 |
| C | 8 | 128 | 37520 | 26.94 | 5139 | 5123 | 1202.6 |
| D | 7 | 238 | 4132560 | 3498.23 | 5151 | 4969 | 1179.9 |
| D | 1 | 52 | 4112121 | 3480.91 | 5151 | 4969 | 1179.9 |
| D | 7 | 223 | 2307980 | 1951.86 | 5151 | 4969 | 1179.9 |
Histogram calculated using DETX and DETY for each event in the final _common_clean file
| Quadrant A |  |
 |
Quadrant B |
|---|---|---|---|
| Quadrant D | 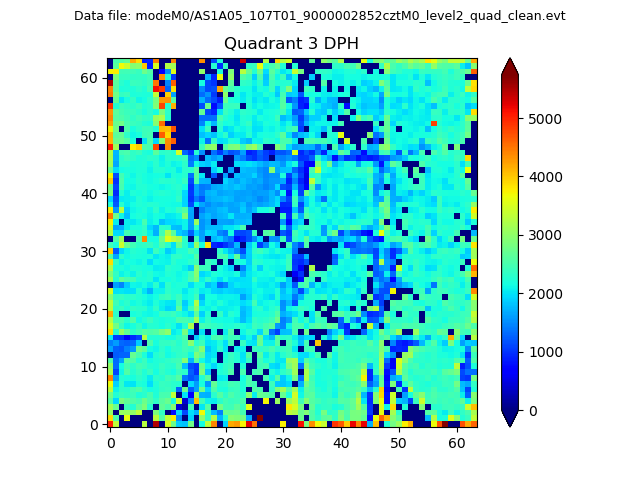 |
 |
Quadrant C |
| Plot type | Count rate plots | Images |
|---|---|---|
| Comparison with Poisson distribution Blue bars denote a histogram of data divided into 1 sec bins. Red curve is a Poisson curve with rate = median count rate of data. |
 |
 |
| Quadrant-wise count rates Data is divided into 100 sec bins |
 |
|
| Module-wise count rates for Quadrant A Data is divided into 100 sec bins |
 |
 |
| Module-wise count rates for Quadrant B Data is divided into 100 sec bins |
 |
 |
| Module-wise count rates for Quadrant C Data is divided into 100 sec bins |
 |
 |
| Module-wise count rates for Quadrant D Data is divided into 100 sec bins |
 |
 |
| Parameter | Plot |
|---|---|
| CZT HV Monitor |  |
| D_VDD |  |
| Temperature 1 |  |
| Veto HV Monitor |  |
| Veto LLD |  |
| Alpha Counter |  |
| _CPM_Rate |  |
| CZT Counter | 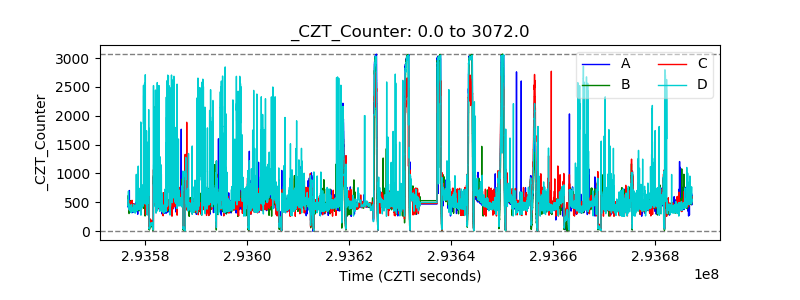 |
| +2.5 Volts monitor |  |
| +5 Volts monitor |  |
| _ROLL_ROT |  |
| _Roll_DEC |  |
| _Roll_RA |  |
| Veto Counter |  |