| Param | Original file | Final file |
|---|---|---|
| Filename | modeM0/AS1A05_115T01_9000002848cztM0_level2_bc.evt | modeM0/AS1A05_115T01_9000002848cztM0_level2_quad_clean.evt |
| Size (bytes) | 2,126,753,280 | 816,900,480 |
| Size | 2.0 GB | 779.1 MB |
| Events in quadrant A | 13,179,741 | 5,179,220 |
| Events in quadrant B | 12,735,658 | 5,295,074 |
| Events in quadrant C | 13,963,858 | 5,099,643 |
| Events in quadrant D | 20,345,788 | 4,960,872 |
| Mode SS | |||
|---|---|---|---|
| Quadrant | BADHDUFLAG | Total packets | Discarded packets |
| A | 0 | 1256 | 0 |
| B | 0 | 1256 | 0 |
| C | 0 | 1256 | 0 |
| D | 0 | 1256 | 0 |
| Mode M9 | |||
|---|---|---|---|
| Quadrant | BADHDUFLAG | Total packets | Discarded packets |
| A | 0 | 87 | 0 |
| B | 0 | 87 | 0 |
| C | 0 | 87 | 0 |
| D | 0 | 87 | 0 |
| Mode M0 | |||
|---|---|---|---|
| Quadrant | BADHDUFLAG | Total packets | Discarded packets |
| A | 0 | 128901 | 0 |
| B | 0 | 127666 | 0 |
| C | 0 | 132142 | 0 |
| D | 0 | 150947 | 0 |
| Quadrant | Total seconds | Saturated seconds | Saturation percentage |
|---|---|---|---|
| A | 61345 | 614 | 1.000897% |
| B | 61345 | 744 | 1.212813% |
| C | 61345 | 1013 | 1.651316% |
| D | 61345 | 1723 | 2.808705% |
Noise dominated data is calculated using 1-second bins in cleaned event files. If a bin has >2000 counts, and if more than 50% of those come from <1% of pixels, then it is considered to be noise-dominated and hence unusable.
| Quadrant | # 1 sec bins | Bins with >0 counts | Bins with >2000 counts | High rate bins dominated by noise | Noise dominated (total time) | Noise dominated (detector-on time) | Marked lightcurve |
|---|---|---|---|---|---|---|---|
| A | 70385 | 61341 | 25 | 25 | 0.04% | 0.04% | 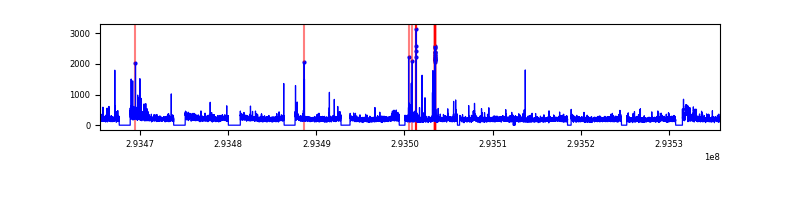 |
| B | 70385 | 61343 | 13 | 13 | 0.02% | 0.02% |  |
| C | 70385 | 61341 | 7 | 7 | 0.01% | 0.01% |  |
| D | 70385 | 61342 | 501 | 501 | 0.71% | 0.82% |  |
Top three noisy pixels from each quadrant. If the there are fewer than three noisy pixels in the level2.evt file, extra rows are filled as -1
| Pixel properties | Quadrant properties | ||||||
|---|---|---|---|---|---|---|---|
| Quadrant | DetID | PixID | Counts | Sigma | Mean | Median | Sigma |
| A | 8 | 205 | 174610 | 245.96 | 3242 | 3178 | 697.0 |
| A | 5 | 16 | 167938 | 236.38 | 3242 | 3178 | 697.0 |
| A | 5 | 247 | 124750 | 174.42 | 3242 | 3178 | 697.0 |
| B | 3 | 64 | 80362 | 125.47 | 3282 | 3195 | 615.0 |
| B | 0 | 214 | 68429 | 106.06 | 3282 | 3195 | 615.0 |
| B | 0 | 229 | 42469 | 63.86 | 3282 | 3195 | 615.0 |
| C | 3 | 233 | 1453450 | 1950.37 | 3180 | 3158 | 743.6 |
| C | 6 | 96 | 117772 | 154.13 | 3180 | 3158 | 743.6 |
| C | 9 | 54 | 101726 | 132.56 | 3180 | 3158 | 743.6 |
| D | 1 | 52 | 5620691 | 7591.05 | 3206 | 3093 | 740.0 |
| D | 7 | 238 | 901746 | 1214.35 | 3206 | 3093 | 740.0 |
| D | 5 | 222 | 536171 | 720.35 | 3206 | 3093 | 740.0 |
Histogram calculated using DETX and DETY for each event in the final _common_clean file
| Quadrant A |  |
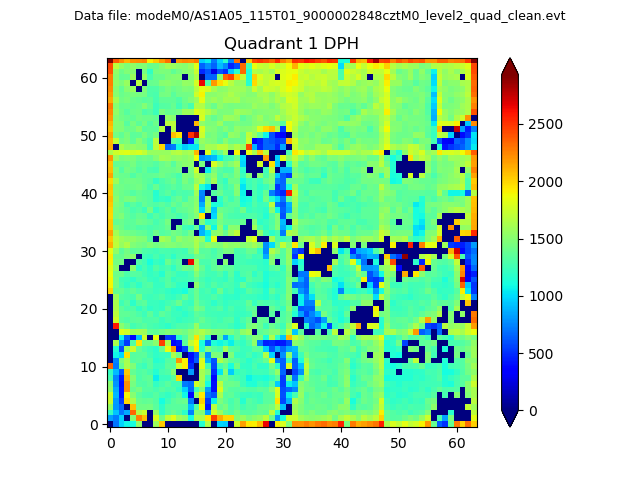 |
Quadrant B |
|---|---|---|---|
| Quadrant D |  |
 |
Quadrant C |
| Plot type | Count rate plots | Images |
|---|---|---|
| Comparison with Poisson distribution Blue bars denote a histogram of data divided into 1 sec bins. Red curve is a Poisson curve with rate = median count rate of data. |
 |
 |
| Quadrant-wise count rates Data is divided into 100 sec bins |
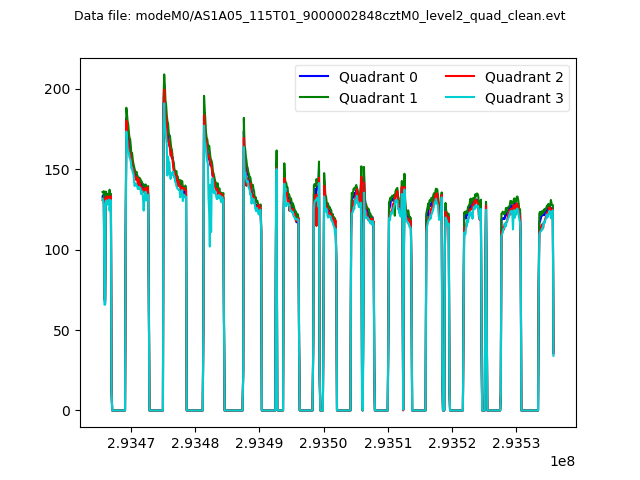 |
|
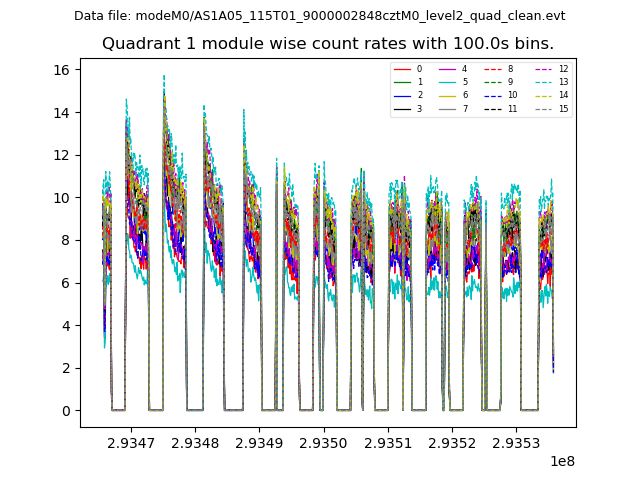
| Module-wise count rates for Quadrant A Data is divided into 100 sec bins |
 |
 |
| Module-wise count rates for Quadrant B Data is divided into 100 sec bins |
 |
 |
| Module-wise count rates for Quadrant C Data is divided into 100 sec bins |
 |
 |
| Module-wise count rates for Quadrant D Data is divided into 100 sec bins |
 |
 |
| Parameter | Plot |
|---|---|
| CZT HV Monitor |  |
| D_VDD |  |
| Temperature 1 |  |
| Veto HV Monitor |  |
| Veto LLD |  |
| Alpha Counter |  |
| _CPM_Rate |  |
| CZT Counter |  |
| +2.5 Volts monitor |  |
| +5 Volts monitor |  |
| _ROLL_ROT |  |
| _Roll_DEC |  |
| _Roll_RA |  |
| Veto Counter |  |