| Param | Original file | Final file |
|---|---|---|
| Filename | modeM0/AS1C04_001T01_9000002846cztM0_level2_bc.evt | modeM0/AS1C04_001T01_9000002846cztM0_level2_quad_clean.evt |
| Size (bytes) | 3,115,477,440 | 1,319,927,040 |
| Size | 2.9 GB | 1.2 GB |
| Events in quadrant A | 17,278,120 | 8,653,311 |
| Events in quadrant B | 18,529,363 | 8,834,514 |
| Events in quadrant C | 21,573,623 | 8,582,094 |
| Events in quadrant D | 31,291,831 | 8,196,861 |
| Mode M9 | |||
|---|---|---|---|
| Quadrant | BADHDUFLAG | Total packets | Discarded packets |
| A | 0 | 145 | 0 |
| B | 0 | 145 | 0 |
| C | 0 | 145 | 0 |
| D | 0 | 145 | 0 |
| Mode SS | |||
|---|---|---|---|
| Quadrant | BADHDUFLAG | Total packets | Discarded packets |
| A | 0 | 1696 | 0 |
| B | 0 | 1696 | 0 |
| C | 0 | 1696 | 0 |
| D | 0 | 1696 | 0 |
| Mode M0 | |||
|---|---|---|---|
| Quadrant | BADHDUFLAG | Total packets | Discarded packets |
| A | 0 | 172971 | 0 |
| B | 0 | 176894 | 0 |
| C | 0 | 186682 | 0 |
| D | 0 | 219936 | 0 |
| Quadrant | Total seconds | Saturated seconds | Saturation percentage |
|---|---|---|---|
| A | 83379 | 800 | 0.959474% |
| B | 83384 | 1170 | 1.403147% |
| C | 83380 | 1483 | 1.778604% |
| D | 83381 | 5386 | 6.459505% |
Noise dominated data is calculated using 1-second bins in cleaned event files. If a bin has >2000 counts, and if more than 50% of those come from <1% of pixels, then it is considered to be noise-dominated and hence unusable.
| Quadrant | # 1 sec bins | Bins with >0 counts | Bins with >2000 counts | High rate bins dominated by noise | Noise dominated (total time) | Noise dominated (detector-on time) | Marked lightcurve |
|---|---|---|---|---|---|---|---|
| A | 97649 | 83380 | 12 | 12 | 0.01% | 0.01% |  |
| B | 97649 | 83378 | 58 | 58 | 0.06% | 0.07% | 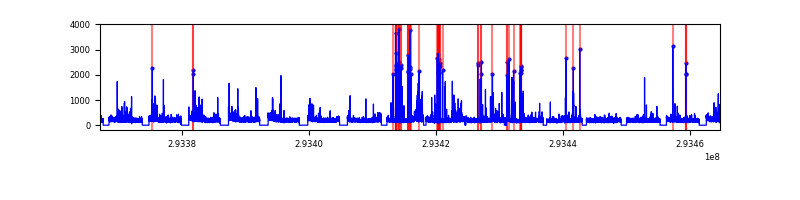 |
| C | 97649 | 83380 | 15 | 15 | 0.02% | 0.02% | 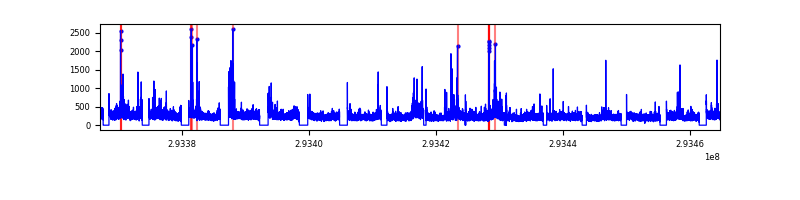 |
| D | 97649 | 83378 | 2021 | 2021 | 2.07% | 2.42% |  |
Top three noisy pixels from each quadrant. If the there are fewer than three noisy pixels in the level2.evt file, extra rows are filled as -1
| Pixel properties | Quadrant properties | ||||||
|---|---|---|---|---|---|---|---|
| Quadrant | DetID | PixID | Counts | Sigma | Mean | Median | Sigma |
| A | 13 | 252 | 184460 | 189.53 | 4387 | 4308 | 950.5 |
| A | 9 | 143 | 107054 | 108.09 | 4387 | 4308 | 950.5 |
| A | 13 | 254 | 106371 | 107.38 | 4387 | 4308 | 950.5 |
| B | 4 | 80 | 460959 | 553.61 | 4452 | 4354 | 824.8 |
| B | 7 | 220 | 215719 | 256.27 | 4452 | 4354 | 824.8 |
| B | 3 | 64 | 182794 | 216.35 | 4452 | 4354 | 824.8 |
| C | 3 | 233 | 4530655 | 4456.28 | 4309 | 4294 | 1015.7 |
| C | 0 | 207 | 425062 | 414.25 | 4309 | 4294 | 1015.7 |
| C | 5 | 4 | 25613 | 20.99 | 4309 | 4294 | 1015.7 |
| D | 5 | 222 | 11032709 | 11098.56 | 4291 | 4154 | 993.7 |
| D | 1 | 52 | 1756075 | 1763.04 | 4291 | 4154 | 993.7 |
| D | 11 | 176 | 796722 | 797.6 | 4291 | 4154 | 993.7 |
Histogram calculated using DETX and DETY for each event in the final _common_clean file
| Quadrant A |  |
 |
Quadrant B |
|---|---|---|---|
| Quadrant D |  |
 |
Quadrant C |
| Plot type | Count rate plots | Images |
|---|---|---|
| Comparison with Poisson distribution Blue bars denote a histogram of data divided into 1 sec bins. Red curve is a Poisson curve with rate = median count rate of data. |
 |
 |
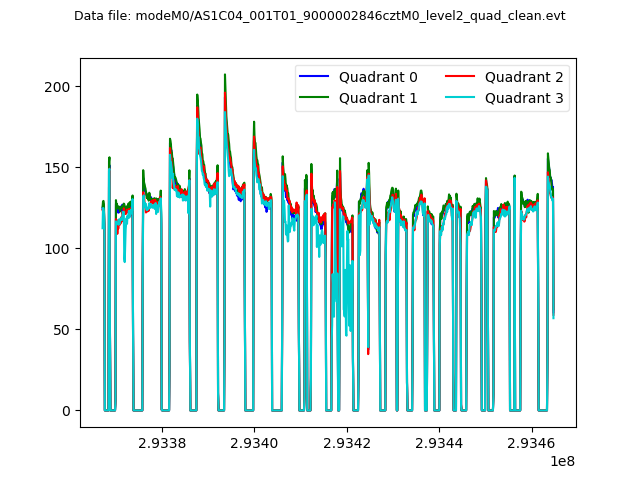
| Quadrant-wise count rates Data is divided into 100 sec bins |
 |
|
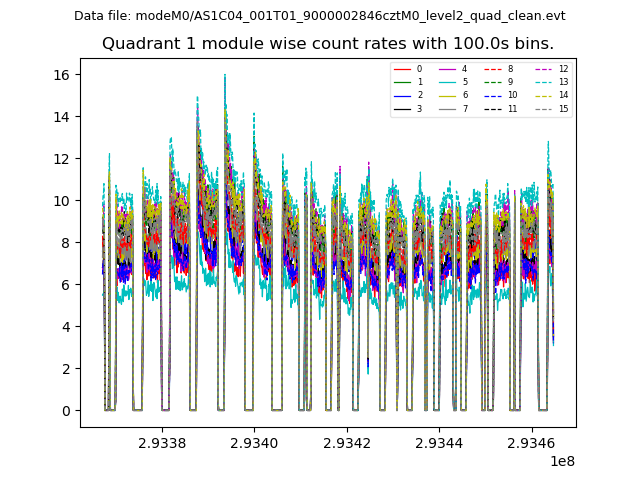
| Module-wise count rates for Quadrant A Data is divided into 100 sec bins |
 |
 |
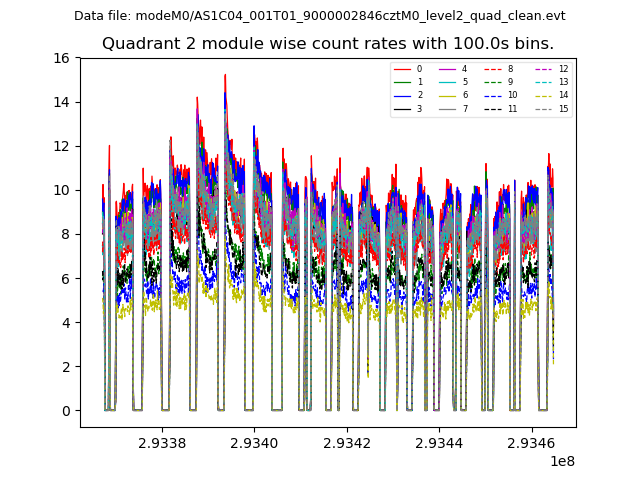
| Module-wise count rates for Quadrant B Data is divided into 100 sec bins |
 |
 |
| Module-wise count rates for Quadrant C Data is divided into 100 sec bins |
 |
 |
| Module-wise count rates for Quadrant D Data is divided into 100 sec bins |
 |
 |
| Parameter | Plot |
|---|---|
| CZT HV Monitor |  |
| D_VDD |  |
| Temperature 1 |  |
| Veto HV Monitor |  |
| Veto LLD | 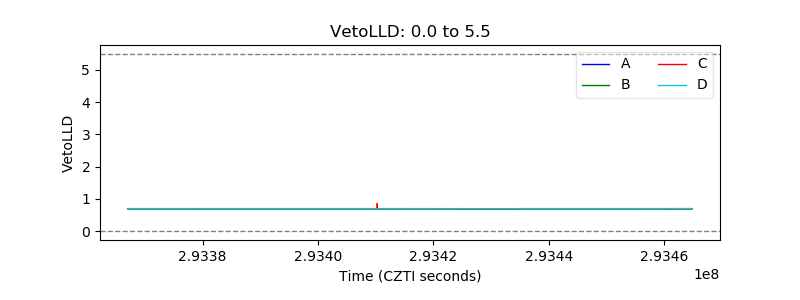 |
| Alpha Counter | 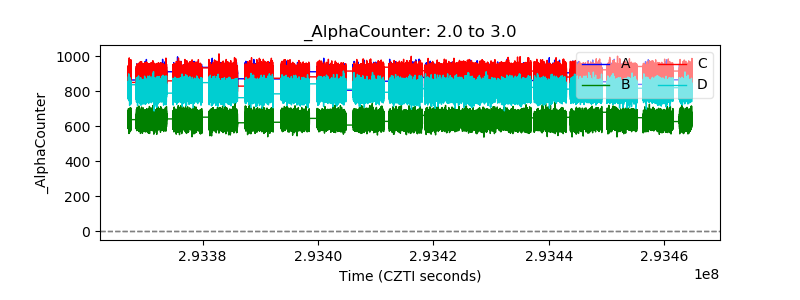 |
| _CPM_Rate |  |
| CZT Counter |  |
| +2.5 Volts monitor |  |
| +5 Volts monitor | 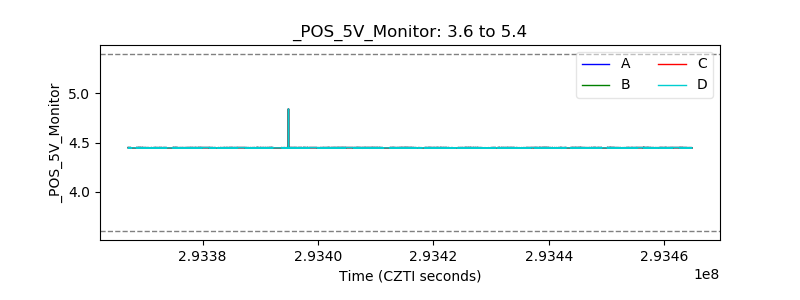 |
| _ROLL_ROT |  |
| _Roll_DEC |  |
| _Roll_RA |  |
| Veto Counter |  |