| Param | Original file | Final file |
|---|---|---|
| Filename | modeM0/AS1A05_075T10_9000002842cztM0_level2_bc.evt | modeM0/AS1A05_075T10_9000002842cztM0_level2_quad_clean.evt |
| Size (bytes) | 355,642,560 | 166,553,280 |
| Size | 339.2 MB | 158.8 MB |
| Events in quadrant A | 2,206,670 | 1,099,888 |
| Events in quadrant B | 2,247,190 | 1,130,038 |
| Events in quadrant C | 2,747,962 | 1,104,151 |
| Events in quadrant D | 2,934,044 | 1,071,917 |
| Mode M9 | |||
|---|---|---|---|
| Quadrant | BADHDUFLAG | Total packets | Discarded packets |
| A | 0 | 26 | 0 |
| B | 0 | 26 | 0 |
| C | 0 | 26 | 0 |
| D | 0 | 26 | 0 |
| Mode SS | |||
|---|---|---|---|
| Quadrant | BADHDUFLAG | Total packets | Discarded packets |
| A | 0 | 186 | 0 |
| B | 0 | 186 | 0 |
| C | 0 | 186 | 0 |
| D | 0 | 186 | 0 |
| Mode M0 | |||
|---|---|---|---|
| Quadrant | BADHDUFLAG | Total packets | Discarded packets |
| A | 0 | 20149 | 0 |
| B | 0 | 20320 | 0 |
| C | 0 | 22503 | 0 |
| D | 0 | 22403 | 0 |
| Quadrant | Total seconds | Saturated seconds | Saturation percentage |
|---|---|---|---|
| A | 9221 | 137 | 1.485739% |
| B | 9221 | 161 | 1.746015% |
| C | 9221 | 242 | 2.624444% |
| D | 9221 | 160 | 1.735170% |
Noise dominated data is calculated using 1-second bins in cleaned event files. If a bin has >2000 counts, and if more than 50% of those come from <1% of pixels, then it is considered to be noise-dominated and hence unusable.
| Quadrant | # 1 sec bins | Bins with >0 counts | Bins with >2000 counts | High rate bins dominated by noise | Noise dominated (total time) | Noise dominated (detector-on time) | Marked lightcurve |
|---|---|---|---|---|---|---|---|
| A | 11771 | 9220 | 2 | 2 | 0.02% | 0.02% |  |
| B | 11771 | 9220 | 0 | 0 | 0.00% | 0.00% |  |
| C | 11771 | 9219 | 0 | 0 | 0.00% | 0.00% |  |
| D | 11771 | 9220 | 8 | 8 | 0.07% | 0.09% | 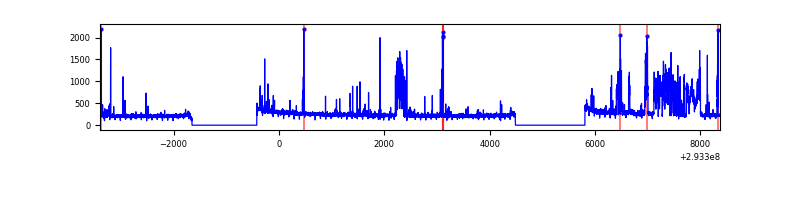 |
Top three noisy pixels from each quadrant. If the there are fewer than three noisy pixels in the level2.evt file, extra rows are filled as -1
| Pixel properties | Quadrant properties | ||||||
|---|---|---|---|---|---|---|---|
| Quadrant | DetID | PixID | Counts | Sigma | Mean | Median | Sigma |
| A | 11 | 29 | 32255 | 263.8 | 557 | 549 | 120.2 |
| A | 9 | 143 | 30040 | 245.37 | 557 | 549 | 120.2 |
| A | 13 | 254 | 10943 | 86.48 | 557 | 549 | 120.2 |
| B | 3 | 64 | 27981 | 261.84 | 571 | 560 | 104.7 |
| B | 0 | 229 | 9169 | 82.21 | 571 | 560 | 104.7 |
| B | 0 | 189 | 8324 | 74.14 | 571 | 560 | 104.7 |
| C | 3 | 233 | 603324 | 4633.16 | 557 | 558 | 130.1 |
| C | 13 | 61 | 3234 | 20.57 | 557 | 558 | 130.1 |
| C | 6 | 96 | 2749 | 16.84 | 557 | 558 | 130.1 |
| D | 1 | 52 | 567523 | 4460.7 | 563 | 545 | 127.1 |
| D | 11 | 176 | 182327 | 1430.17 | 563 | 545 | 127.1 |
| D | 2 | 234 | 41210 | 319.93 | 563 | 545 | 127.1 |
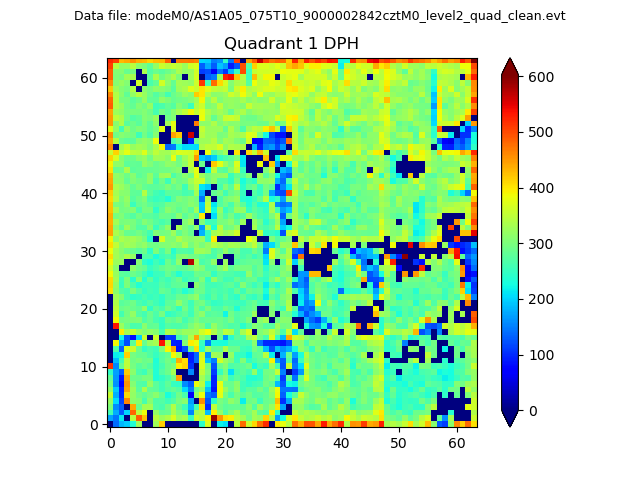
Histogram calculated using DETX and DETY for each event in the final _common_clean file
| Quadrant A |  |
 |
Quadrant B |
|---|---|---|---|
| Quadrant D | 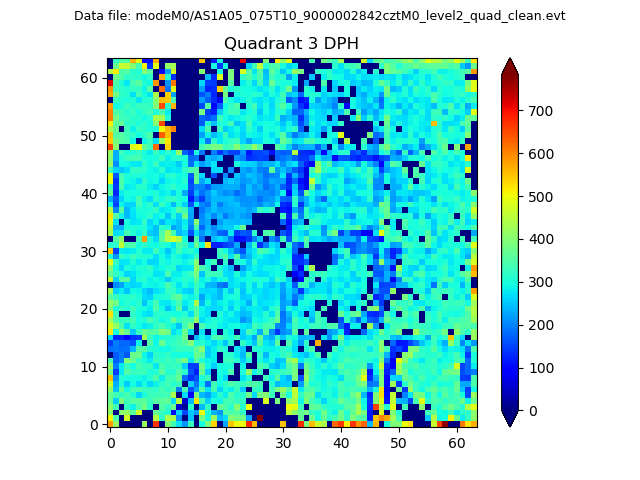 |
 |
Quadrant C |
| Plot type | Count rate plots | Images |
|---|---|---|
| Comparison with Poisson distribution Blue bars denote a histogram of data divided into 1 sec bins. Red curve is a Poisson curve with rate = median count rate of data. |
 |
 |
| Quadrant-wise count rates Data is divided into 100 sec bins |
 |
|
| Module-wise count rates for Quadrant A Data is divided into 100 sec bins |
 |
 |
| Module-wise count rates for Quadrant B Data is divided into 100 sec bins |
 |
 |
| Module-wise count rates for Quadrant C Data is divided into 100 sec bins |
 |
 |
| Module-wise count rates for Quadrant D Data is divided into 100 sec bins |
 |
 |
| Parameter | Plot |
|---|---|
| CZT HV Monitor |  |
| D_VDD | 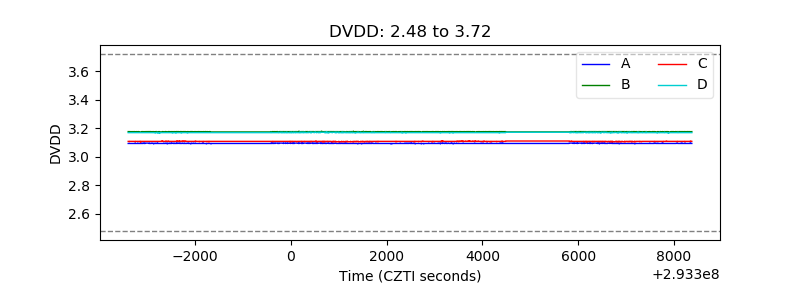 |
| Temperature 1 | 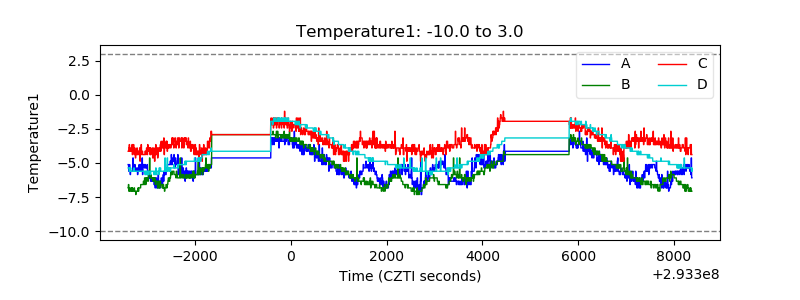 |
| Veto HV Monitor |  |
| Veto LLD |  |
| Alpha Counter |  |
| _CPM_Rate | 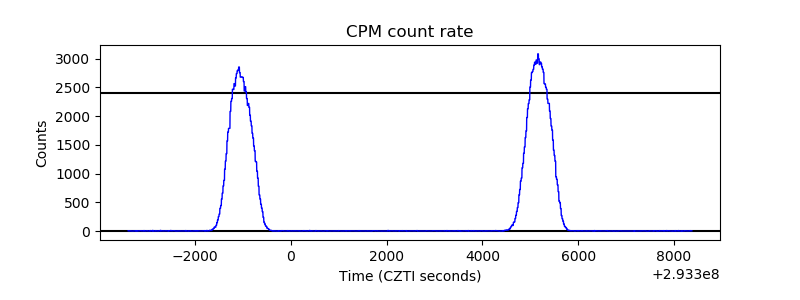 |
| CZT Counter |  |
| +2.5 Volts monitor |  |
| +5 Volts monitor |  |
| _ROLL_ROT |  |
| _Roll_DEC |  |
| _Roll_RA | 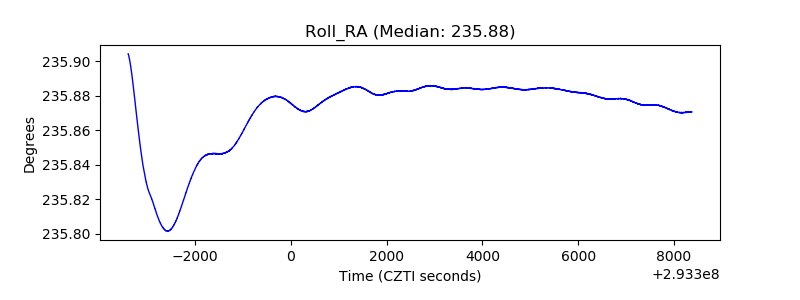 |
| Veto Counter | 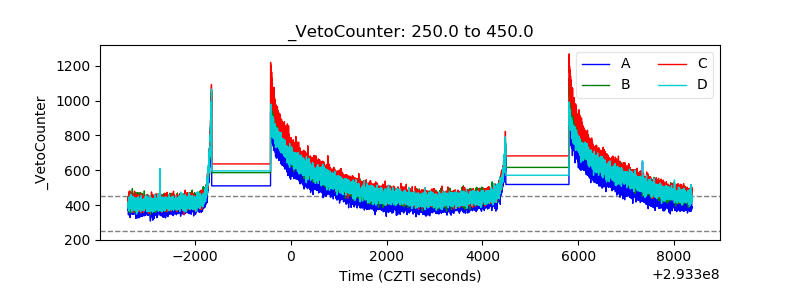 |