| Param | Original file | Final file |
|---|---|---|
| Filename | modeM0/AS1A05_063T03_9000002840cztM0_level2_bc.evt | modeM0/AS1A05_063T03_9000002840cztM0_level2_quad_clean.evt |
| Size (bytes) | 1,044,552,960 | 371,928,960 |
| Size | 996.2 MB | 354.7 MB |
| Events in quadrant A | 5,914,886 | 2,334,436 |
| Events in quadrant B | 6,008,918 | 2,385,285 |
| Events in quadrant C | 10,424,537 | 2,298,345 |
| Events in quadrant D | 7,331,860 | 2,280,061 |
| Mode M9 | |||
|---|---|---|---|
| Quadrant | BADHDUFLAG | Total packets | Discarded packets |
| A | 0 | 37 | 0 |
| B | 0 | 38 | 0 |
| C | 0 | 38 | 0 |
| D | 0 | 38 | 0 |
| Mode SS | |||
|---|---|---|---|
| Quadrant | BADHDUFLAG | Total packets | Discarded packets |
| A | 0 | 582 | 0 |
| B | 0 | 582 | 0 |
| C | 0 | 582 | 0 |
| D | 0 | 582 | 0 |
| Mode M0 | |||
|---|---|---|---|
| Quadrant | BADHDUFLAG | Total packets | Discarded packets |
| A | 0 | 59998 | 0 |
| B | 0 | 60103 | 0 |
| C | 0 | 78976 | 0 |
| D | 0 | 64741 | 0 |
| Quadrant | Total seconds | Saturated seconds | Saturation percentage |
|---|---|---|---|
| A | 28617 | 428 | 1.495614% |
| B | 28617 | 499 | 1.743719% |
| C | 28617 | 866 | 3.026173% |
| D | 28617 | 415 | 1.450187% |
Noise dominated data is calculated using 1-second bins in cleaned event files. If a bin has >2000 counts, and if more than 50% of those come from <1% of pixels, then it is considered to be noise-dominated and hence unusable.
| Quadrant | # 1 sec bins | Bins with >0 counts | Bins with >2000 counts | High rate bins dominated by noise | Noise dominated (total time) | Noise dominated (detector-on time) | Marked lightcurve |
|---|---|---|---|---|---|---|---|
| A | 48954 | 28615 | 11 | 11 | 0.02% | 0.04% |  |
| B | 48954 | 28617 | 5 | 5 | 0.01% | 0.02% |  |
| C | 48954 | 28616 | 0 | 0 | 0.00% | 0.00% | 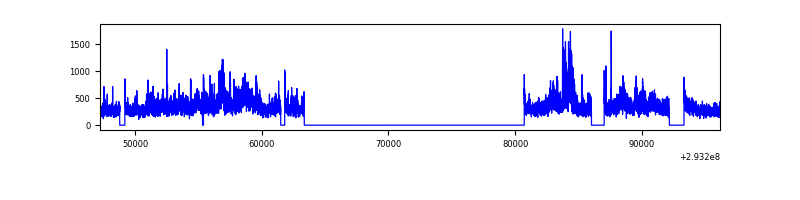 |
| D | 48954 | 28616 | 58 | 58 | 0.12% | 0.20% |  |
Top three noisy pixels from each quadrant. If the there are fewer than three noisy pixels in the level2.evt file, extra rows are filled as -1
| Pixel properties | Quadrant properties | ||||||
|---|---|---|---|---|---|---|---|
| Quadrant | DetID | PixID | Counts | Sigma | Mean | Median | Sigma |
| A | 9 | 143 | 159385 | 482.64 | 1491 | 1459 | 327.2 |
| A | 13 | 254 | 32269 | 94.16 | 1491 | 1459 | 327.2 |
| A | 0 | 226 | 9636 | 24.99 | 1491 | 1459 | 327.2 |
| B | 0 | 190 | 32727 | 109.8 | 1515 | 1477 | 284.6 |
| B | 0 | 214 | 29246 | 97.57 | 1515 | 1477 | 284.6 |
| B | 0 | 229 | 28844 | 96.16 | 1515 | 1477 | 284.6 |
| C | 3 | 233 | 4820768 | 14212.55 | 1450 | 1440 | 339.1 |
| C | 8 | 128 | 15145 | 40.42 | 1450 | 1440 | 339.1 |
| C | 13 | 61 | 8546 | 20.96 | 1450 | 1440 | 339.1 |
| D | 1 | 52 | 798497 | 2328.41 | 1485 | 1433 | 342.3 |
| D | 11 | 176 | 581281 | 1693.87 | 1485 | 1433 | 342.3 |
| D | 2 | 234 | 114331 | 329.8 | 1485 | 1433 | 342.3 |
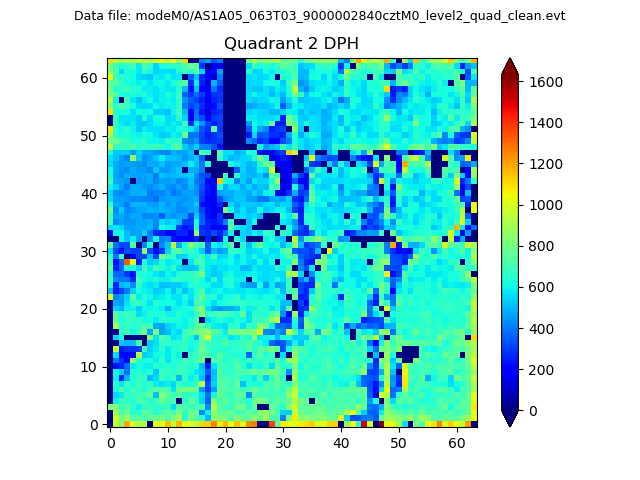
Histogram calculated using DETX and DETY for each event in the final _common_clean file
| Quadrant A |  |
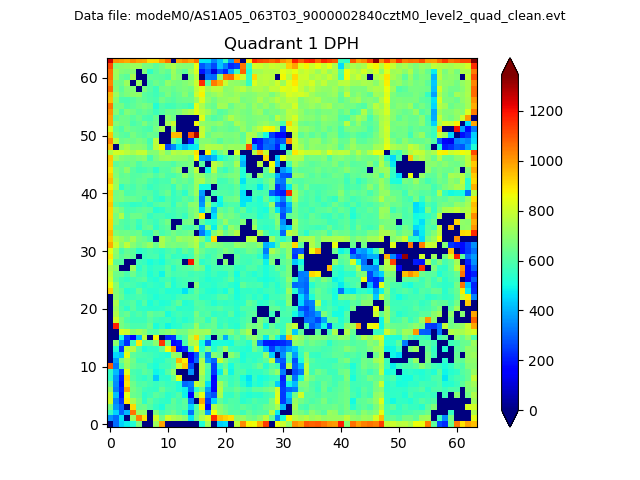 |
Quadrant B |
|---|---|---|---|
| Quadrant D |  |
 |
Quadrant C |
| Plot type | Count rate plots | Images |
|---|---|---|
| Comparison with Poisson distribution Blue bars denote a histogram of data divided into 1 sec bins. Red curve is a Poisson curve with rate = median count rate of data. |
 |
 |
| Quadrant-wise count rates Data is divided into 100 sec bins |
 |
|
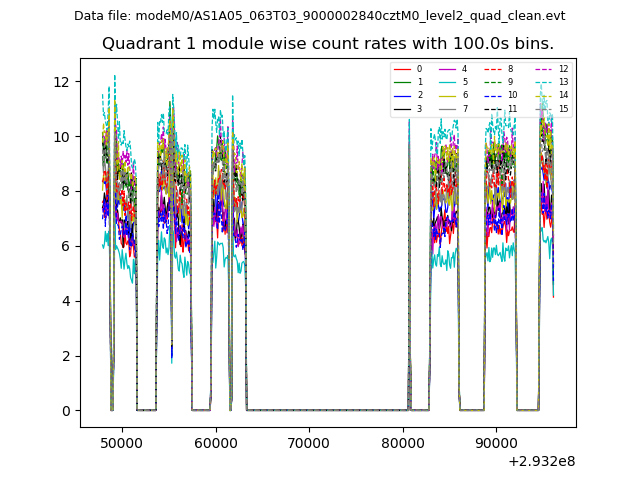
| Module-wise count rates for Quadrant A Data is divided into 100 sec bins |
 |
 |
| Module-wise count rates for Quadrant B Data is divided into 100 sec bins |
 |
 |
| Module-wise count rates for Quadrant C Data is divided into 100 sec bins |
 |
 |
| Module-wise count rates for Quadrant D Data is divided into 100 sec bins |
 |
 |
| Parameter | Plot |
|---|---|
| CZT HV Monitor |  |
| D_VDD | 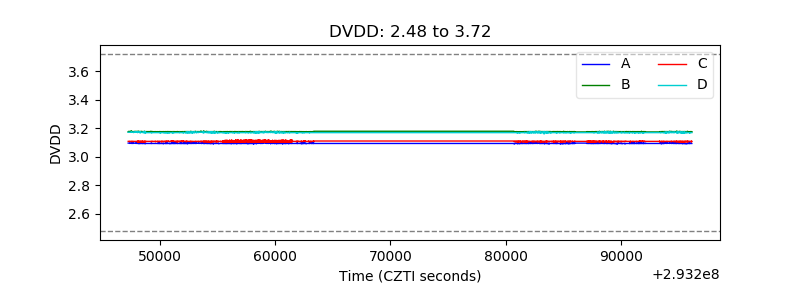 |
| Temperature 1 |  |
| Veto HV Monitor | 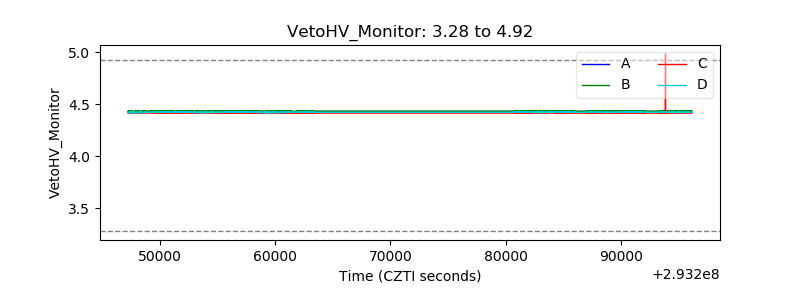 |
| Veto LLD |  |
| Alpha Counter |  |
| _CPM_Rate |  |
| CZT Counter |  |
| +2.5 Volts monitor |  |
| +5 Volts monitor |  |
| _ROLL_ROT | 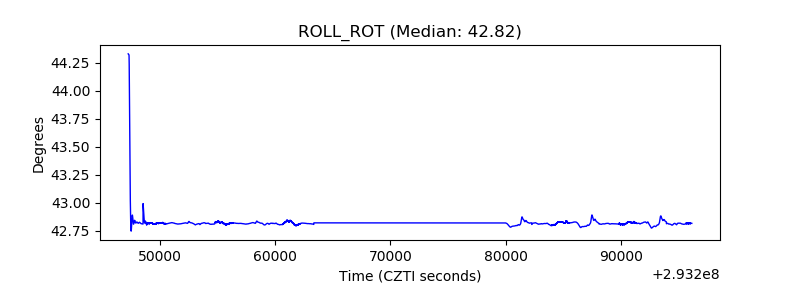 |
| _Roll_DEC | 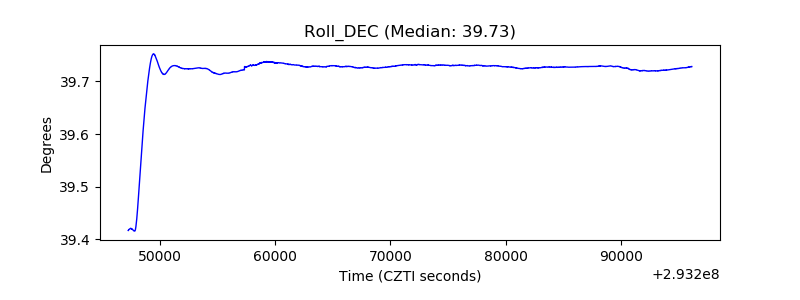 |
| _Roll_RA | 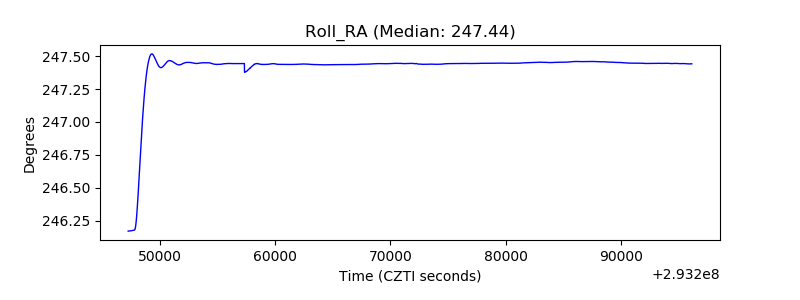 |
| Veto Counter |  |