| Param | Original file | Final file |
|---|---|---|
| Filename | modeM0/AS1A05_007T06_9000002844cztM0_level2_bc.evt | modeM0/AS1A05_007T06_9000002844cztM0_level2_quad_clean.evt |
| Size (bytes) | 1,752,454,080 | 726,068,160 |
| Size | 1.6 GB | 692.4 MB |
| Events in quadrant A | 10,422,726 | 4,615,702 |
| Events in quadrant B | 10,634,257 | 4,746,073 |
| Events in quadrant C | 14,962,722 | 4,626,105 |
| Events in quadrant D | 13,550,882 | 4,481,586 |
| Mode SS | |||
|---|---|---|---|
| Quadrant | BADHDUFLAG | Total packets | Discarded packets |
| A | 0 | 1042 | 0 |
| B | 0 | 1042 | 0 |
| C | 0 | 1042 | 0 |
| D | 0 | 1042 | 0 |
| Mode M9 | |||
|---|---|---|---|
| Quadrant | BADHDUFLAG | Total packets | Discarded packets |
| A | 0 | 67 | 0 |
| B | 0 | 67 | 0 |
| C | 0 | 67 | 0 |
| D | 0 | 67 | 0 |
| Mode M0 | |||
|---|---|---|---|
| Quadrant | BADHDUFLAG | Total packets | Discarded packets |
| A | 0 | 106171 | 0 |
| B | 0 | 106468 | 0 |
| C | 0 | 122492 | 0 |
| D | 0 | 117179 | 0 |
| Quadrant | Total seconds | Saturated seconds | Saturation percentage |
|---|---|---|---|
| A | 51366 | 534 | 1.039598% |
| B | 51366 | 597 | 1.162247% |
| C | 51366 | 980 | 1.907877% |
| D | 51366 | 1275 | 2.482187% |
Noise dominated data is calculated using 1-second bins in cleaned event files. If a bin has >2000 counts, and if more than 50% of those come from <1% of pixels, then it is considered to be noise-dominated and hence unusable.
| Quadrant | # 1 sec bins | Bins with >0 counts | Bins with >2000 counts | High rate bins dominated by noise | Noise dominated (total time) | Noise dominated (detector-on time) | Marked lightcurve |
|---|---|---|---|---|---|---|---|
| A | 57871 | 51365 | 27 | 27 | 0.05% | 0.05% | 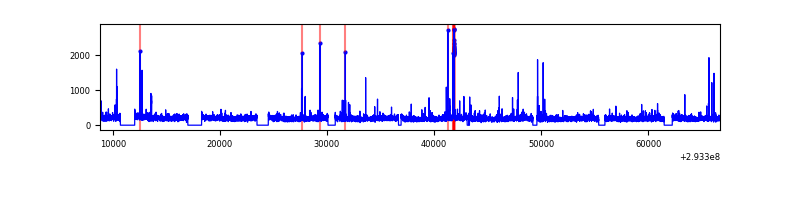 |
| B | 57871 | 51367 | 3 | 3 | 0.01% | 0.01% |  |
| C | 57871 | 51368 | 0 | 0 | 0.00% | 0.00% | 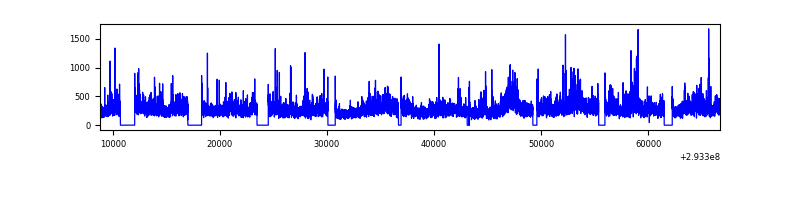 |
| D | 57871 | 51367 | 187 | 187 | 0.32% | 0.36% |  |
Top three noisy pixels from each quadrant. If the there are fewer than three noisy pixels in the level2.evt file, extra rows are filled as -1
| Pixel properties | Quadrant properties | ||||||
|---|---|---|---|---|---|---|---|
| Quadrant | DetID | PixID | Counts | Sigma | Mean | Median | Sigma |
| A | 9 | 143 | 331724 | 578.47 | 2610 | 2558 | 569.0 |
| A | 13 | 254 | 61055 | 102.8 | 2610 | 2558 | 569.0 |
| A | 0 | 226 | 16821 | 25.07 | 2610 | 2558 | 569.0 |
| B | 0 | 229 | 69330 | 133.17 | 2667 | 2602 | 501.1 |
| B | 7 | 220 | 62799 | 120.14 | 2667 | 2602 | 501.1 |
| B | 4 | 216 | 57021 | 108.61 | 2667 | 2602 | 501.1 |
| C | 3 | 233 | 4953137 | 8116.76 | 2573 | 2556 | 609.9 |
| C | 0 | 207 | 66465 | 104.78 | 2573 | 2556 | 609.9 |
| C | 5 | 4 | 33846 | 51.3 | 2573 | 2556 | 609.9 |
| D | 11 | 176 | 2481788 | 4131.56 | 2595 | 2506 | 600.1 |
| D | 5 | 222 | 322128 | 532.63 | 2595 | 2506 | 600.1 |
| D | 1 | 52 | 223573 | 368.39 | 2595 | 2506 | 600.1 |
Histogram calculated using DETX and DETY for each event in the final _common_clean file
| Quadrant A |  |
 |
Quadrant B |
|---|---|---|---|
| Quadrant D |  |
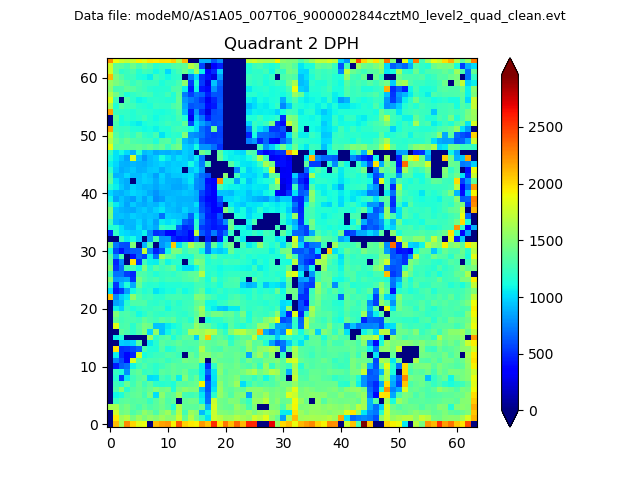 |
Quadrant C |
| Plot type | Count rate plots | Images |
|---|---|---|
| Comparison with Poisson distribution Blue bars denote a histogram of data divided into 1 sec bins. Red curve is a Poisson curve with rate = median count rate of data. |
 |
 |
| Quadrant-wise count rates Data is divided into 100 sec bins |
 |
|
| Module-wise count rates for Quadrant A Data is divided into 100 sec bins |
 |
 |
| Module-wise count rates for Quadrant B Data is divided into 100 sec bins |
 |
 |
| Module-wise count rates for Quadrant C Data is divided into 100 sec bins |
 |
 |
| Module-wise count rates for Quadrant D Data is divided into 100 sec bins |
 |
 |
| Parameter | Plot |
|---|---|
| CZT HV Monitor |  |
| D_VDD | 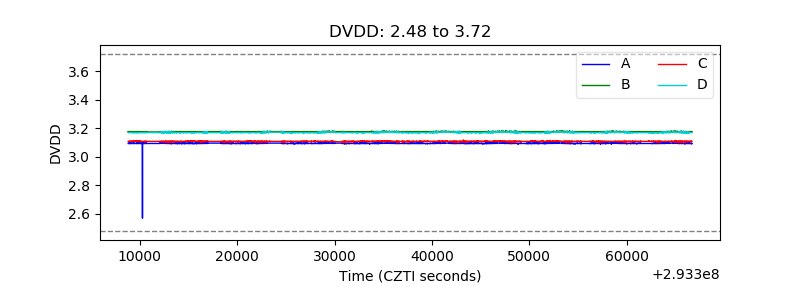 |
| Temperature 1 |  |
| Veto HV Monitor |  |
| Veto LLD |  |
| Alpha Counter |  |
| _CPM_Rate | 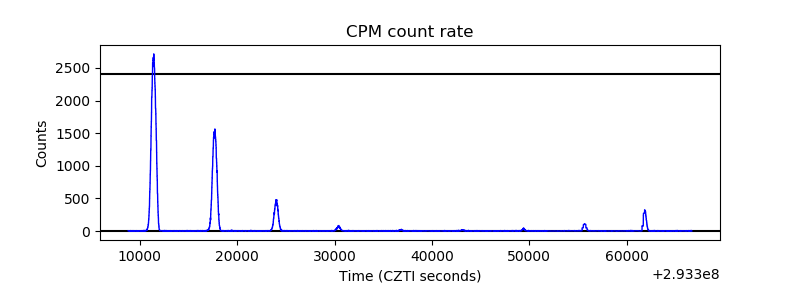 |
| CZT Counter |  |
| +2.5 Volts monitor |  |
| +5 Volts monitor |  |
| _ROLL_ROT | 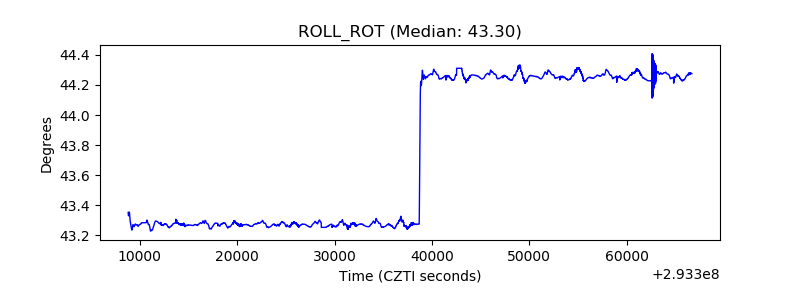 |
| _Roll_DEC | 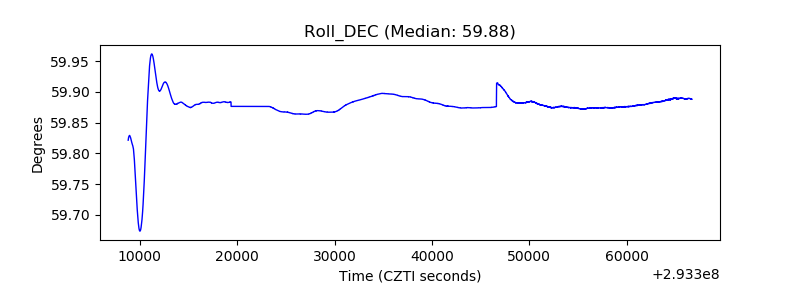 |
| _Roll_RA |  |
| Veto Counter | 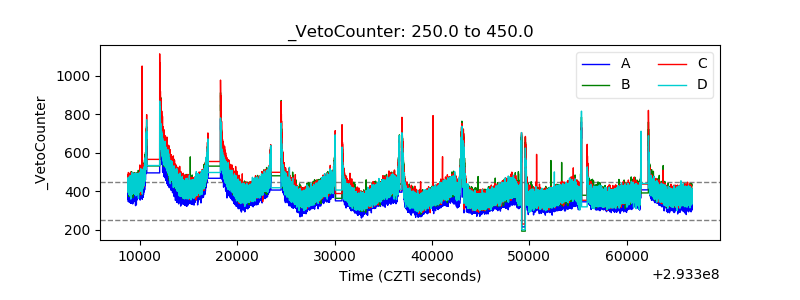 |