| Param | Original file | Final file |
|---|---|---|
| Filename | modeM0/AS1A05_046T01_9000002838cztM0_level2_bc.evt | modeM0/AS1A05_046T01_9000002838cztM0_level2_quad_clean.evt |
| Size (bytes) | 17,115,998,400 | 6,046,525,440 |
| Size | 15.9 GB | 5.6 GB |
| Events in quadrant A | 103,627,164 | 38,300,021 |
| Events in quadrant B | 107,558,375 | 39,508,652 |
| Events in quadrant C | 118,108,349 | 38,130,040 |
| Events in quadrant D | 158,552,961 | 36,500,373 |
| Mode M0 | |||
|---|---|---|---|
| Quadrant | BADHDUFLAG | Total packets | Discarded packets |
| A | 0 | 966668 | 0 |
| B | 0 | 985705 | 0 |
| C | 0 | 1034366 | 0 |
| D | 0 | 1165163 | 0 |
| Mode SS | |||
|---|---|---|---|
| Quadrant | BADHDUFLAG | Total packets | Discarded packets |
| A | 0 | 9132 | 0 |
| B | 0 | 9132 | 0 |
| C | 0 | 9132 | 0 |
| D | 0 | 9132 | 0 |
| Mode M9 | |||
|---|---|---|---|
| Quadrant | BADHDUFLAG | Total packets | Discarded packets |
| A | 0 | 732 | 0 |
| B | 0 | 732 | 0 |
| C | 0 | 732 | 0 |
| D | 0 | 732 | 0 |
| Quadrant | Total seconds | Saturated seconds | Saturation percentage |
|---|---|---|---|
| A | 448533 | 6042 | 1.347058% |
| B | 448534 | 8545 | 1.905095% |
| C | 448534 | 9592 | 2.138522% |
| D | 448533 | 22177 | 4.944341% |
Noise dominated data is calculated using 1-second bins in cleaned event files. If a bin has >2000 counts, and if more than 50% of those come from <1% of pixels, then it is considered to be noise-dominated and hence unusable.
| Quadrant | # 1 sec bins | Bins with >0 counts | Bins with >2000 counts | High rate bins dominated by noise | Noise dominated (total time) | Noise dominated (detector-on time) | Marked lightcurve |
|---|---|---|---|---|---|---|---|
| A | 551201 | 448528 | 225 | 225 | 0.04% | 0.05% |  |
| B | 551201 | 448525 | 164 | 164 | 0.03% | 0.04% | 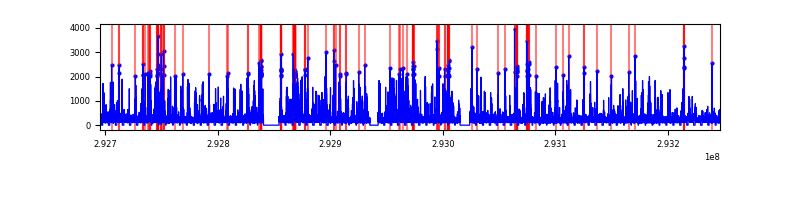 |
| C | 551201 | 448537 | 72 | 72 | 0.01% | 0.02% |  |
| D | 551201 | 448537 | 4849 | 4849 | 0.88% | 1.08% | 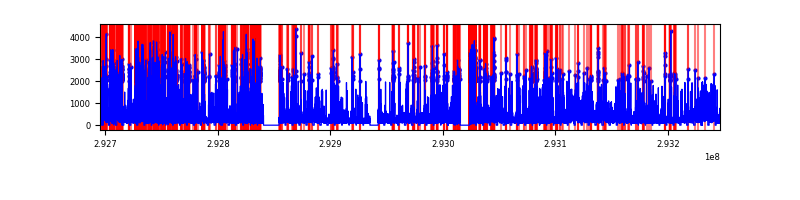 |
Top three noisy pixels from each quadrant. If the there are fewer than three noisy pixels in the level2.evt file, extra rows are filled as -1
| Pixel properties | Quadrant properties | ||||||
|---|---|---|---|---|---|---|---|
| Quadrant | DetID | PixID | Counts | Sigma | Mean | Median | Sigma |
| A | 8 | 192 | 9561862 | 1864.15 | 23715 | 23262 | 5116.9 |
| A | 15 | 174 | 822554 | 156.21 | 23715 | 23262 | 5116.9 |
| A | 13 | 170 | 510645 | 95.25 | 23715 | 23262 | 5116.9 |
| B | 7 | 220 | 3101163 | 684.07 | 24190 | 23596 | 4498.9 |
| B | 3 | 64 | 2972778 | 655.53 | 24190 | 23596 | 4498.9 |
| B | 10 | 245 | 1874981 | 411.52 | 24190 | 23596 | 4498.9 |
| C | 3 | 233 | 27542961 | 5015.6 | 23324 | 23184 | 5486.8 |
| C | 0 | 207 | 788981 | 139.57 | 23324 | 23184 | 5486.8 |
| C | 13 | 61 | 135808 | 20.53 | 23324 | 23184 | 5486.8 |
| D | 10 | 66 | 21707294 | 4047.1 | 23280 | 22460 | 5358.1 |
| D | 1 | 52 | 21378653 | 3985.77 | 23280 | 22460 | 5358.1 |
| D | 11 | 176 | 9568507 | 1781.61 | 23280 | 22460 | 5358.1 |
Histogram calculated using DETX and DETY for each event in the final _common_clean file
| Quadrant A |  |
 |
Quadrant B |
|---|---|---|---|
| Quadrant D |  |
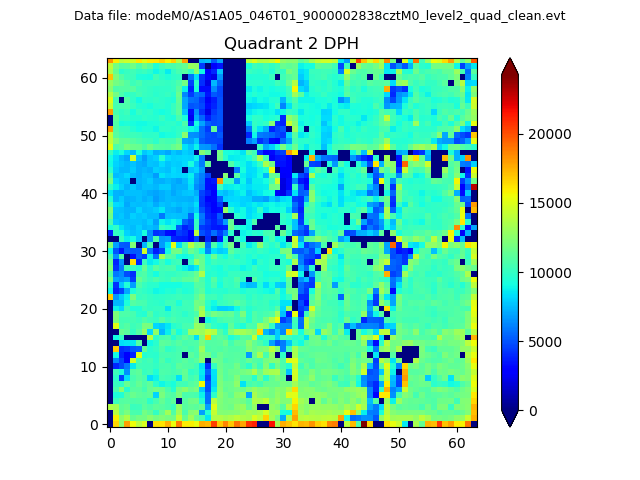 |
Quadrant C |
| Plot type | Count rate plots | Images |
|---|---|---|
| Comparison with Poisson distribution Blue bars denote a histogram of data divided into 1 sec bins. Red curve is a Poisson curve with rate = median count rate of data. |
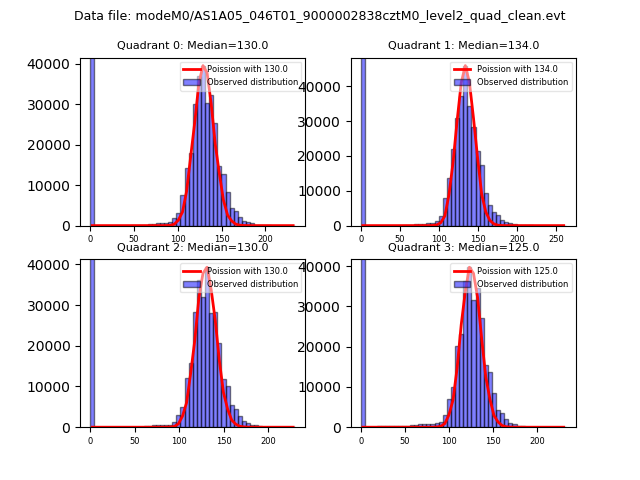 |
 |
| Quadrant-wise count rates Data is divided into 100 sec bins |
 |
|
| Module-wise count rates for Quadrant A Data is divided into 100 sec bins |
 |
 |
| Module-wise count rates for Quadrant B Data is divided into 100 sec bins |
 |
 |
| Module-wise count rates for Quadrant C Data is divided into 100 sec bins |
 |
 |
| Module-wise count rates for Quadrant D Data is divided into 100 sec bins |
 |
 |
| Parameter | Plot |
|---|---|
| CZT HV Monitor | 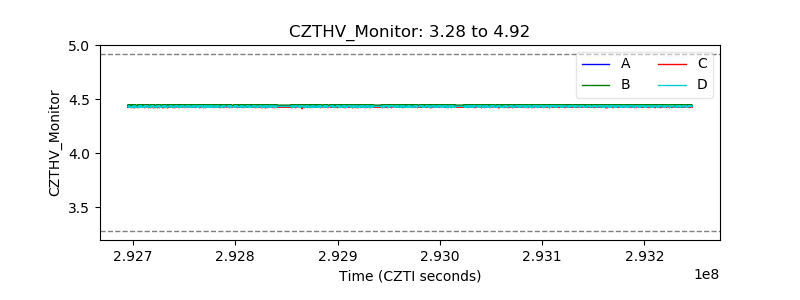 |
| D_VDD |  |
| Temperature 1 |  |
| Veto HV Monitor |  |
| Veto LLD |  |
| Alpha Counter |  |
| _CPM_Rate |  |
| CZT Counter |  |
| +2.5 Volts monitor | 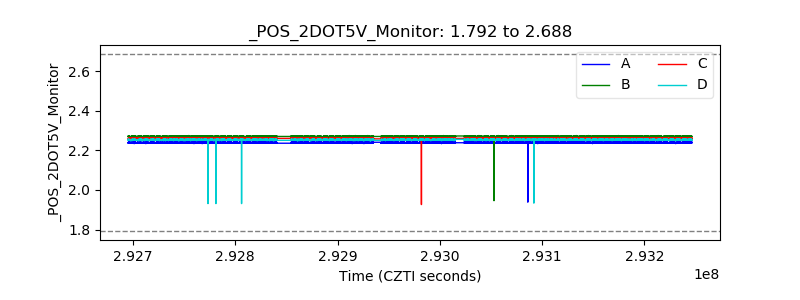 |
| +5 Volts monitor |  |
| _ROLL_ROT |  |
| _Roll_DEC |  |
| _Roll_RA |  |
| Veto Counter |  |