| Param | Original file | Final file |
|---|---|---|
| Filename | modeM0/AS1T03_098T01_9000002836cztM0_level2_bc.evt | modeM0/AS1T03_098T01_9000002836cztM0_level2_quad_clean.evt |
| Size (bytes) | 4,813,079,040 | 1,563,341,760 |
| Size | 4.5 GB | 1.5 GB |
| Events in quadrant A | 24,231,559 | 9,911,535 |
| Events in quadrant B | 30,112,904 | 10,071,424 |
| Events in quadrant C | 25,840,688 | 9,857,880 |
| Events in quadrant D | 57,452,161 | 9,330,593 |
| Mode M9 | |||
|---|---|---|---|
| Quadrant | BADHDUFLAG | Total packets | Discarded packets |
| A | 0 | 169 | 0 |
| B | 0 | 169 | 0 |
| C | 0 | 169 | 0 |
| D | 0 | 169 | 0 |
| Mode M0 | |||
|---|---|---|---|
| Quadrant | BADHDUFLAG | Total packets | Discarded packets |
| A | 0 | 246875 | 0 |
| B | 0 | 269083 | 0 |
| C | 0 | 255523 | 0 |
| D | 0 | 365021 | 0 |
| Mode SS | |||
|---|---|---|---|
| Quadrant | BADHDUFLAG | Total packets | Discarded packets |
| A | 0 | 2428 | 0 |
| B | 0 | 2428 | 0 |
| C | 0 | 2428 | 0 |
| D | 0 | 2428 | 0 |
| Quadrant | Total seconds | Saturated seconds | Saturation percentage |
|---|---|---|---|
| A | 119384 | 1458 | 1.221269% |
| B | 119384 | 3109 | 2.604202% |
| C | 119384 | 2249 | 1.883837% |
| D | 119384 | 10341 | 8.661965% |
Noise dominated data is calculated using 1-second bins in cleaned event files. If a bin has >2000 counts, and if more than 50% of those come from <1% of pixels, then it is considered to be noise-dominated and hence unusable.
| Quadrant | # 1 sec bins | Bins with >0 counts | Bins with >2000 counts | High rate bins dominated by noise | Noise dominated (total time) | Noise dominated (detector-on time) | Marked lightcurve |
|---|---|---|---|---|---|---|---|
| A | 136240 | 119386 | 0 | 0 | 0.00% | 0.00% | 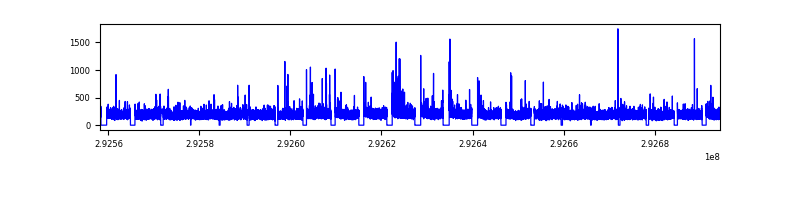 |
| B | 136240 | 119385 | 145 | 145 | 0.11% | 0.12% |  |
| C | 136240 | 119381 | 21 | 21 | 0.02% | 0.02% |  |
| D | 136240 | 119376 | 2105 | 2105 | 1.55% | 1.76% |  |
Top three noisy pixels from each quadrant. If the there are fewer than three noisy pixels in the level2.evt file, extra rows are filled as -1
| Pixel properties | Quadrant properties | ||||||
|---|---|---|---|---|---|---|---|
| Quadrant | DetID | PixID | Counts | Sigma | Mean | Median | Sigma |
| A | 8 | 192 | 170094 | 121.48 | 6180 | 6075 | 1350.2 |
| A | 4 | 2 | 118151 | 83.01 | 6180 | 6075 | 1350.2 |
| A | 13 | 254 | 106967 | 74.72 | 6180 | 6075 | 1350.2 |
| B | 10 | 245 | 2135302 | 1817.77 | 6236 | 6080 | 1171.3 |
| B | 3 | 112 | 958882 | 813.43 | 6236 | 6080 | 1171.3 |
| B | 4 | 216 | 749333 | 634.53 | 6236 | 6080 | 1171.3 |
| C | 3 | 233 | 2080369 | 1456.95 | 6037 | 6007 | 1423.8 |
| C | 0 | 207 | 409871 | 283.66 | 6037 | 6007 | 1423.8 |
| C | 7 | 220 | 68658 | 44.0 | 6037 | 6007 | 1423.8 |
| D | 7 | 238 | 11514336 | 8245.91 | 5928 | 5721 | 1395.7 |
| D | 1 | 52 | 10360918 | 7419.49 | 5928 | 5721 | 1395.7 |
| D | 11 | 176 | 6655194 | 4764.34 | 5928 | 5721 | 1395.7 |
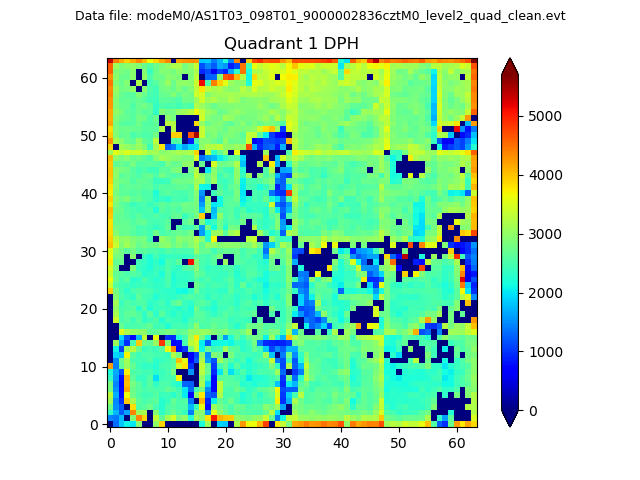
Histogram calculated using DETX and DETY for each event in the final _common_clean file
| Quadrant A |  |
 |
Quadrant B |
|---|---|---|---|
| Quadrant D |  |
 |
Quadrant C |
| Plot type | Count rate plots | Images |
|---|---|---|
| Comparison with Poisson distribution Blue bars denote a histogram of data divided into 1 sec bins. Red curve is a Poisson curve with rate = median count rate of data. |
 |
 |
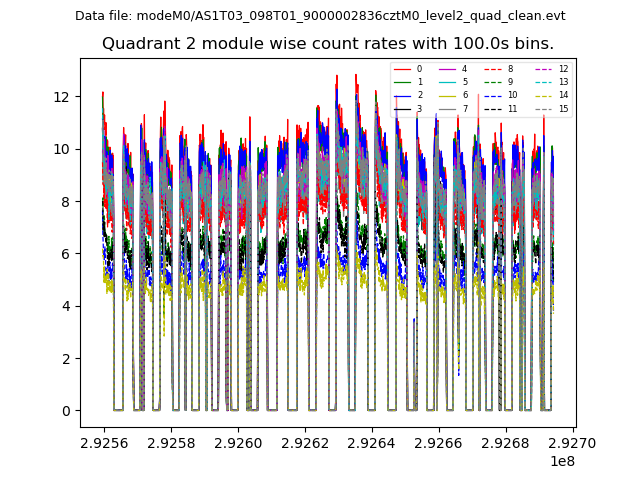
| Quadrant-wise count rates Data is divided into 100 sec bins |
 |
|
| Module-wise count rates for Quadrant A Data is divided into 100 sec bins |
 |
 |
| Module-wise count rates for Quadrant B Data is divided into 100 sec bins |
 |
 |
| Module-wise count rates for Quadrant C Data is divided into 100 sec bins |
 |
 |
| Module-wise count rates for Quadrant D Data is divided into 100 sec bins |
 |
 |
| Parameter | Plot |
|---|---|
| CZT HV Monitor |  |
| D_VDD |  |
| Temperature 1 |  |
| Veto HV Monitor |  |
| Veto LLD | 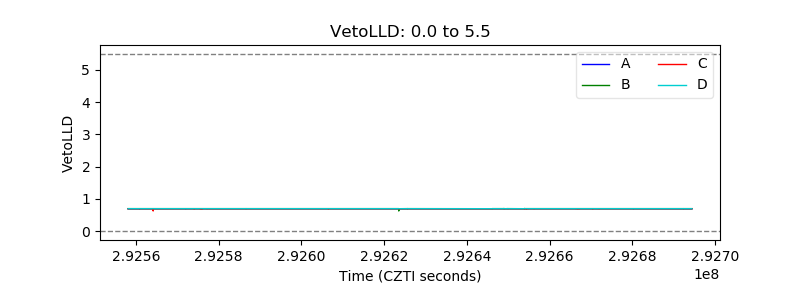 |
| Alpha Counter | 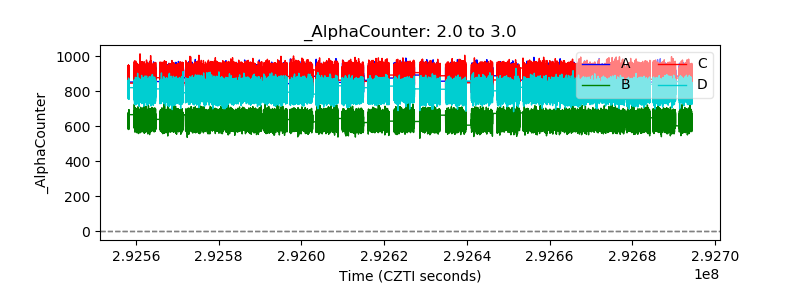 |
| _CPM_Rate |  |
| CZT Counter |  |
| +2.5 Volts monitor | 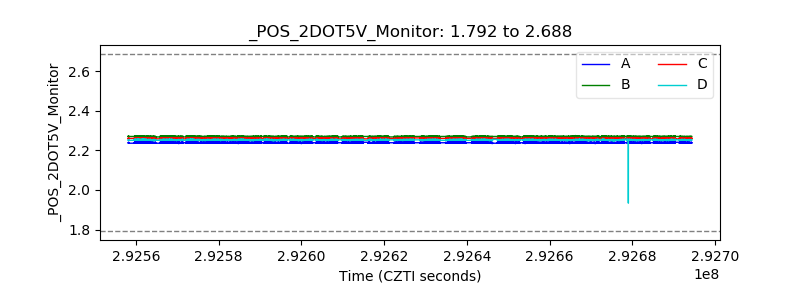 |
| +5 Volts monitor |  |
| _ROLL_ROT |  |
| _Roll_DEC | 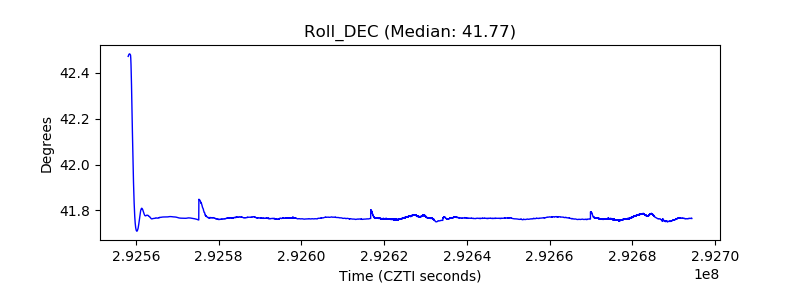 |
| _Roll_RA | 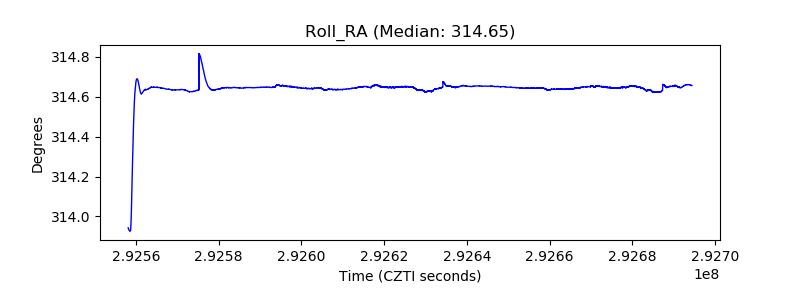 |
| Veto Counter |  |