| Param | Original file | Final file |
|---|---|---|
| Filename | modeM0/AS1A05_046T01_9000002834cztM0_level2_bc.evt | modeM0/AS1A05_046T01_9000002834cztM0_level2_quad_clean.evt |
| Size (bytes) | 12,345,600,960 | 4,046,302,080 |
| Size | 11.5 GB | 3.8 GB |
| Events in quadrant A | 63,139,793 | 25,943,859 |
| Events in quadrant B | 78,045,213 | 26,538,511 |
| Events in quadrant C | 70,375,031 | 25,668,261 |
| Events in quadrant D | 141,618,654 | 23,567,780 |
| Mode SS | |||
|---|---|---|---|
| Quadrant | BADHDUFLAG | Total packets | Discarded packets |
| A | 0 | 6198 | 0 |
| B | 0 | 6198 | 0 |
| C | 0 | 6198 | 0 |
| D | 0 | 6198 | 0 |
| Mode M0 | |||
|---|---|---|---|
| Quadrant | BADHDUFLAG | Total packets | Discarded packets |
| A | 0 | 631920 | 0 |
| B | 0 | 686941 | 0 |
| C | 0 | 661814 | 0 |
| D | 0 | 957163 | 0 |
| Mode M9 | |||
|---|---|---|---|
| Quadrant | BADHDUFLAG | Total packets | Discarded packets |
| A | 0 | 505 | 0 |
| B | 0 | 505 | 0 |
| C | 0 | 505 | 0 |
| D | 0 | 505 | 0 |
| Quadrant | Total seconds | Saturated seconds | Saturation percentage |
|---|---|---|---|
| A | 304314 | 3587 | 1.178717% |
| B | 304314 | 7120 | 2.339689% |
| C | 304313 | 6640 | 2.181964% |
| D | 304314 | 34526 | 11.345518% |
Noise dominated data is calculated using 1-second bins in cleaned event files. If a bin has >2000 counts, and if more than 50% of those come from <1% of pixels, then it is considered to be noise-dominated and hence unusable.
| Quadrant | # 1 sec bins | Bins with >0 counts | Bins with >2000 counts | High rate bins dominated by noise | Noise dominated (total time) | Noise dominated (detector-on time) | Marked lightcurve |
|---|---|---|---|---|---|---|---|
| A | 371256 | 304326 | 47 | 47 | 0.01% | 0.02% |  |
| B | 371256 | 304320 | 435 | 435 | 0.12% | 0.14% | 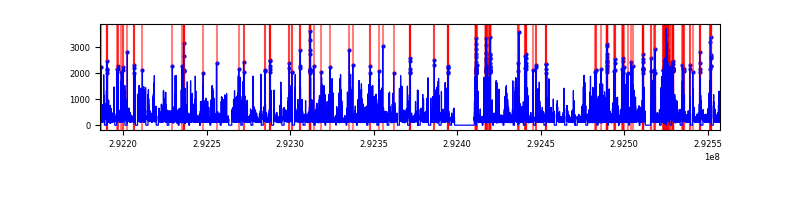 |
| C | 371256 | 304323 | 501 | 501 | 0.13% | 0.16% |  |
| D | 371256 | 304285 | 2777 | 2777 | 0.75% | 0.91% | 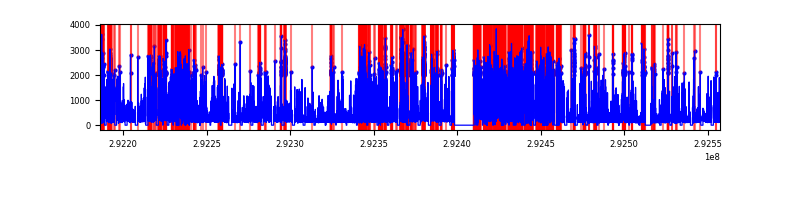 |
Top three noisy pixels from each quadrant. If the there are fewer than three noisy pixels in the level2.evt file, extra rows are filled as -1
| Pixel properties | Quadrant properties | ||||||
|---|---|---|---|---|---|---|---|
| Quadrant | DetID | PixID | Counts | Sigma | Mean | Median | Sigma |
| A | 9 | 143 | 594486 | 165.94 | 16114 | 15804 | 3487.2 |
| A | 13 | 254 | 353776 | 96.92 | 16114 | 15804 | 3487.2 |
| A | 14 | 235 | 132021 | 33.33 | 16114 | 15804 | 3487.2 |
| B | 3 | 112 | 6526722 | 2139.72 | 16320 | 15888 | 3042.8 |
| B | 7 | 220 | 2598837 | 848.86 | 16320 | 15888 | 3042.8 |
| B | 6 | 36 | 1296596 | 420.89 | 16320 | 15888 | 3042.8 |
| C | 3 | 233 | 5640091 | 1517.23 | 15767 | 15691 | 3707.0 |
| C | 9 | 54 | 2656249 | 712.32 | 15767 | 15691 | 3707.0 |
| C | 9 | 15 | 748760 | 197.75 | 15767 | 15691 | 3707.0 |
| D | 7 | 238 | 57616204 | 16474.6 | 15215 | 14684 | 3496.4 |
| D | 1 | 20 | 11425316 | 3263.55 | 15215 | 14684 | 3496.4 |
| D | 1 | 52 | 7531051 | 2149.75 | 15215 | 14684 | 3496.4 |
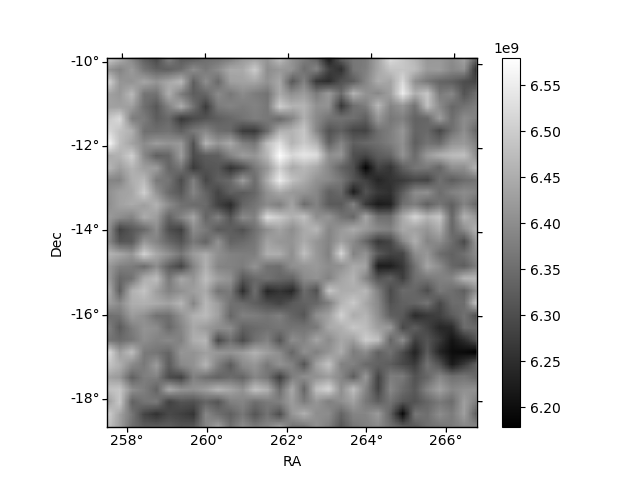
Histogram calculated using DETX and DETY for each event in the final _common_clean file
| Quadrant A |  |
 |
Quadrant B |
|---|---|---|---|
| Quadrant D |  |
 |
Quadrant C |
| Plot type | Count rate plots | Images |
|---|---|---|
| Comparison with Poisson distribution Blue bars denote a histogram of data divided into 1 sec bins. Red curve is a Poisson curve with rate = median count rate of data. |
 |
 |
| Quadrant-wise count rates Data is divided into 100 sec bins |
 |
|
| Module-wise count rates for Quadrant A Data is divided into 100 sec bins |
 |
 |
| Module-wise count rates for Quadrant B Data is divided into 100 sec bins |
 |
 |
| Module-wise count rates for Quadrant C Data is divided into 100 sec bins |
 |
 |
| Module-wise count rates for Quadrant D Data is divided into 100 sec bins |
 |
 |
| Parameter | Plot |
|---|---|
| CZT HV Monitor |  |
| D_VDD |  |
| Temperature 1 |  |
| Veto HV Monitor |  |
| Veto LLD |  |
| Alpha Counter | 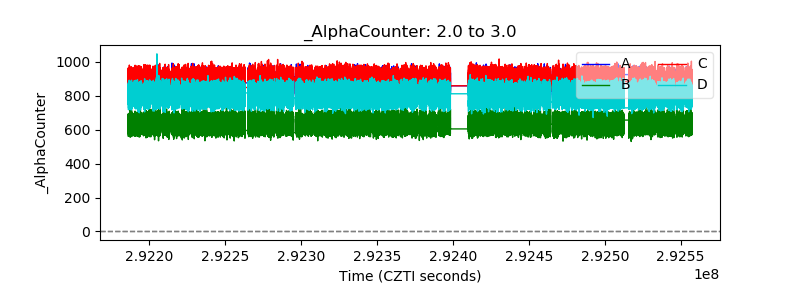 |
| _CPM_Rate |  |
| CZT Counter |  |
| +2.5 Volts monitor | 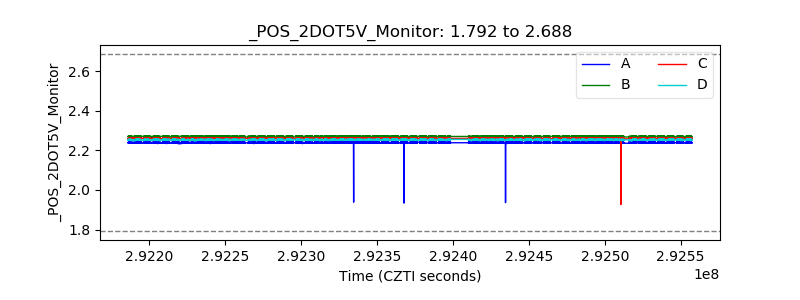 |
| +5 Volts monitor |  |
| _ROLL_ROT |  |
| _Roll_DEC | 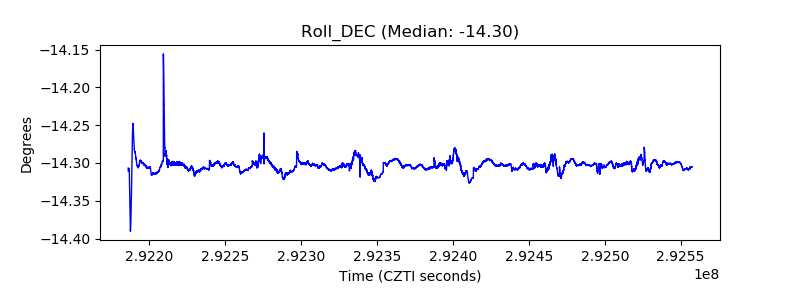 |
| _Roll_RA |  |
| Veto Counter |  |