| Param | Original file | Final file |
|---|---|---|
| Filename | modeM0/AS1A05_022T03_9000002832cztM0_level2_bc.evt | modeM0/AS1A05_022T03_9000002832cztM0_level2_quad_clean.evt |
| Size (bytes) | 510,739,200 | 159,249,600 |
| Size | 487.1 MB | 151.9 MB |
| Events in quadrant A | 2,724,331 | 1,045,453 |
| Events in quadrant B | 3,545,596 | 1,049,420 |
| Events in quadrant C | 2,748,034 | 1,010,712 |
| Events in quadrant D | 5,487,480 | 751,739 |
| Mode M0 | |||
|---|---|---|---|
| Quadrant | BADHDUFLAG | Total packets | Discarded packets |
| A | 0 | 28704 | 0 |
| B | 0 | 31583 | 0 |
| C | 0 | 28995 | 0 |
| D | 0 | 59973 | 0 |
| Mode M9 | |||
|---|---|---|---|
| Quadrant | BADHDUFLAG | Total packets | Discarded packets |
| A | 0 | 20 | 0 |
| B | 0 | 20 | 0 |
| C | 0 | 20 | 0 |
| D | 0 | 20 | 0 |
| Mode SS | |||
|---|---|---|---|
| Quadrant | BADHDUFLAG | Total packets | Discarded packets |
| A | 0 | 284 | 0 |
| B | 0 | 284 | 0 |
| C | 0 | 284 | 0 |
| D | 0 | 284 | 0 |
| Quadrant | Total seconds | Saturated seconds | Saturation percentage |
|---|---|---|---|
| A | 13973 | 185 | 1.323982% |
| B | 13973 | 391 | 2.798254% |
| C | 13973 | 251 | 1.796321% |
| D | 13973 | 4416 | 31.603807% |
Noise dominated data is calculated using 1-second bins in cleaned event files. If a bin has >2000 counts, and if more than 50% of those come from <1% of pixels, then it is considered to be noise-dominated and hence unusable.
| Quadrant | # 1 sec bins | Bins with >0 counts | Bins with >2000 counts | High rate bins dominated by noise | Noise dominated (total time) | Noise dominated (detector-on time) | Marked lightcurve |
|---|---|---|---|---|---|---|---|
| A | 15913 | 13973 | 0 | 0 | 0.00% | 0.00% |  |
| B | 15913 | 13973 | 13 | 13 | 0.08% | 0.09% |  |
| C | 15913 | 13973 | 0 | 0 | 0.00% | 0.00% |  |
| D | 15913 | 13939 | 151 | 151 | 0.95% | 1.08% |  |
Top three noisy pixels from each quadrant. If the there are fewer than three noisy pixels in the level2.evt file, extra rows are filled as -1
| Pixel properties | Quadrant properties | ||||||
|---|---|---|---|---|---|---|---|
| Quadrant | DetID | PixID | Counts | Sigma | Mean | Median | Sigma |
| A | 14 | 235 | 13136 | 79.02 | 702 | 685 | 157.6 |
| A | 13 | 254 | 11388 | 67.93 | 702 | 685 | 157.6 |
| A | 12 | 194 | 4489 | 24.14 | 702 | 685 | 157.6 |
| B | 3 | 112 | 671554 | 4849.61 | 705 | 686 | 138.3 |
| B | 0 | 190 | 45023 | 320.51 | 705 | 686 | 138.3 |
| B | 0 | 198 | 38431 | 272.85 | 705 | 686 | 138.3 |
| C | 3 | 233 | 140615 | 858.99 | 678 | 670 | 162.9 |
| C | 13 | 61 | 3946 | 20.11 | 678 | 670 | 162.9 |
| C | 14 | 238 | 2368 | 10.42 | 678 | 670 | 162.9 |
| D | 1 | 52 | 1965287 | 16281.45 | 510 | 491 | 120.7 |
| D | 7 | 238 | 1480507 | 12264.28 | 510 | 491 | 120.7 |
| D | 2 | 234 | 47321 | 388.06 | 510 | 491 | 120.7 |
Histogram calculated using DETX and DETY for each event in the final _common_clean file
| Quadrant A |  |
 |
Quadrant B |
|---|---|---|---|
| Quadrant D |  |
 |
Quadrant C |
| Plot type | Count rate plots | Images |
|---|---|---|
| Comparison with Poisson distribution Blue bars denote a histogram of data divided into 1 sec bins. Red curve is a Poisson curve with rate = median count rate of data. |
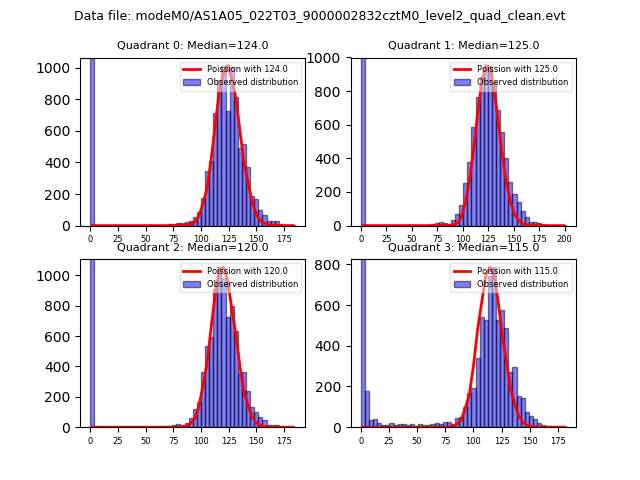 |
 |
| Quadrant-wise count rates Data is divided into 100 sec bins |
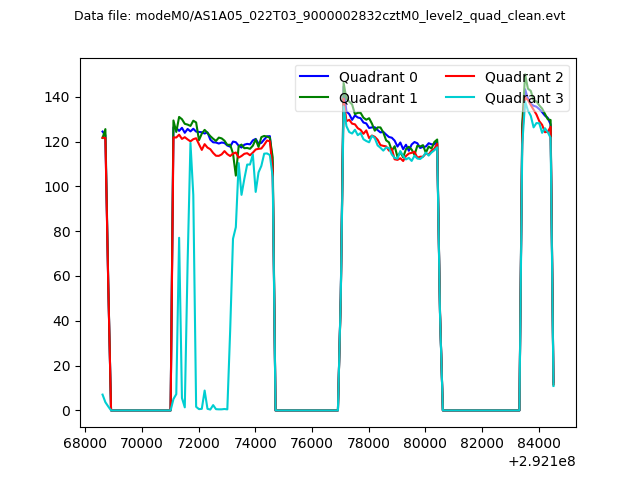 |
|
| Module-wise count rates for Quadrant A Data is divided into 100 sec bins |
 |
 |
| Module-wise count rates for Quadrant B Data is divided into 100 sec bins |
 |
 |
| Module-wise count rates for Quadrant C Data is divided into 100 sec bins |
 |
 |
| Module-wise count rates for Quadrant D Data is divided into 100 sec bins |
 |
 |
| Parameter | Plot |
|---|---|
| CZT HV Monitor |  |
| D_VDD |  |
| Temperature 1 |  |
| Veto HV Monitor |  |
| Veto LLD |  |
| Alpha Counter |  |
| _CPM_Rate |  |
| CZT Counter |  |
| +2.5 Volts monitor |  |
| +5 Volts monitor |  |
| _ROLL_ROT |  |
| _Roll_DEC |  |
| _Roll_RA |  |
| Veto Counter |  |