| Param | Original file | Final file |
|---|---|---|
| Filename | modeM0/AS1A06_003T05_9000002830cztM0_level2_bc.evt | modeM0/AS1A06_003T05_9000002830cztM0_level2_quad_clean.evt |
| Size (bytes) | 5,735,076,480 | 1,626,166,080 |
| Size | 5.3 GB | 1.5 GB |
| Events in quadrant A | 47,409,311 | 9,979,492 |
| Events in quadrant B | 32,987,109 | 10,617,860 |
| Events in quadrant C | 29,752,982 | 10,075,554 |
| Events in quadrant D | 54,385,257 | 9,371,152 |
| Mode M9 | |||
|---|---|---|---|
| Quadrant | BADHDUFLAG | Total packets | Discarded packets |
| A | 0 | 214 | 0 |
| B | 0 | 214 | 0 |
| C | 0 | 214 | 0 |
| D | 0 | 214 | 0 |
| Mode SS | |||
|---|---|---|---|
| Quadrant | BADHDUFLAG | Total packets | Discarded packets |
| A | 0 | 2732 | 0 |
| B | 0 | 2732 | 0 |
| C | 0 | 2732 | 0 |
| D | 0 | 2732 | 0 |
| Mode M0 | |||
|---|---|---|---|
| Quadrant | BADHDUFLAG | Total packets | Discarded packets |
| A | 0 | 396602 | 0 |
| B | 0 | 296548 | 0 |
| C | 0 | 287252 | 0 |
| D | 0 | 393715 | 0 |
| Quadrant | Total seconds | Saturated seconds | Saturation percentage |
|---|---|---|---|
| A | 134363 | 16784 | 12.491534% |
| B | 134365 | 3328 | 2.476835% |
| C | 134365 | 2899 | 2.157556% |
| D | 134364 | 10451 | 7.778125% |
Noise dominated data is calculated using 1-second bins in cleaned event files. If a bin has >2000 counts, and if more than 50% of those come from <1% of pixels, then it is considered to be noise-dominated and hence unusable.
| Quadrant | # 1 sec bins | Bins with >0 counts | Bins with >2000 counts | High rate bins dominated by noise | Noise dominated (total time) | Noise dominated (detector-on time) | Marked lightcurve |
|---|---|---|---|---|---|---|---|
| A | 155725 | 134323 | 322 | 322 | 0.21% | 0.24% |  |
| B | 155725 | 134371 | 112 | 112 | 0.07% | 0.08% |  |
| C | 155725 | 134370 | 15 | 15 | 0.01% | 0.01% |  |
| D | 155725 | 134332 | 721 | 721 | 0.46% | 0.54% |  |
Top three noisy pixels from each quadrant. If the there are fewer than three noisy pixels in the level2.evt file, extra rows are filled as -1
| Pixel properties | Quadrant properties | ||||||
|---|---|---|---|---|---|---|---|
| Quadrant | DetID | PixID | Counts | Sigma | Mean | Median | Sigma |
| A | 14 | 235 | 21330661 | 14821.62 | 6696 | 6582 | 1438.7 |
| A | 9 | 143 | 169641 | 113.34 | 6696 | 6582 | 1438.7 |
| A | 13 | 254 | 102818 | 66.89 | 6696 | 6582 | 1438.7 |
| B | 3 | 112 | 2483883 | 1843.58 | 7197 | 7012 | 1343.5 |
| B | 7 | 220 | 1124344 | 831.65 | 7197 | 7012 | 1343.5 |
| B | 0 | 189 | 500722 | 367.48 | 7197 | 7012 | 1343.5 |
| C | 3 | 233 | 3125622 | 1964.11 | 6834 | 6809 | 1587.9 |
| C | 5 | 112 | 180174 | 109.18 | 6834 | 6809 | 1587.9 |
| C | 9 | 54 | 61259 | 34.29 | 6834 | 6809 | 1587.9 |
| D | 7 | 238 | 15895104 | 10315.97 | 6715 | 6475 | 1540.2 |
| D | 1 | 52 | 9603180 | 6230.83 | 6715 | 6475 | 1540.2 |
| D | 2 | 233 | 1961004 | 1269.01 | 6715 | 6475 | 1540.2 |
Histogram calculated using DETX and DETY for each event in the final _common_clean file
| Quadrant A | 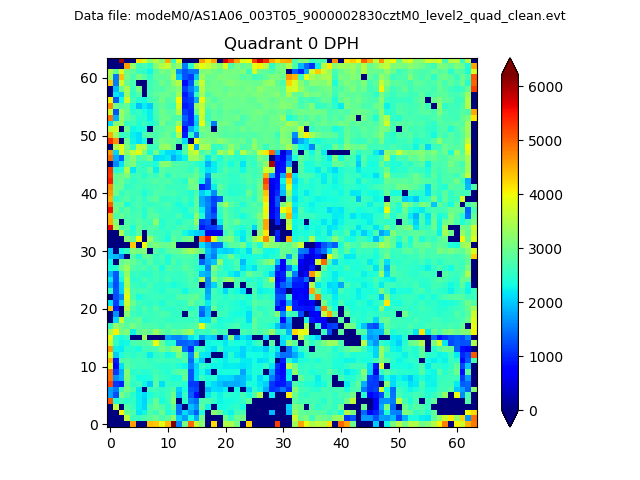 |
 |
Quadrant B |
|---|---|---|---|
| Quadrant D | 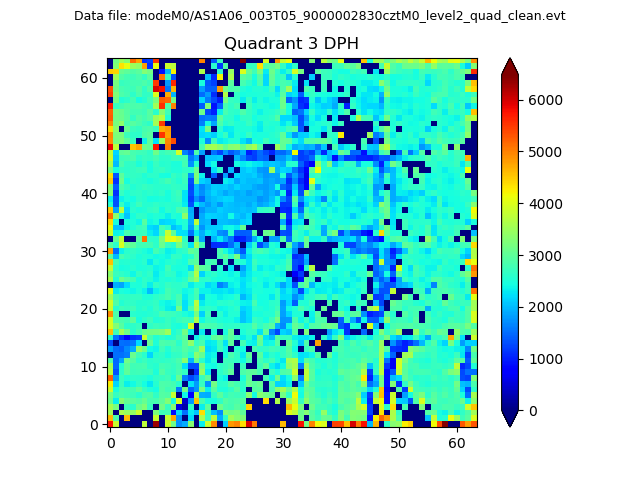 |
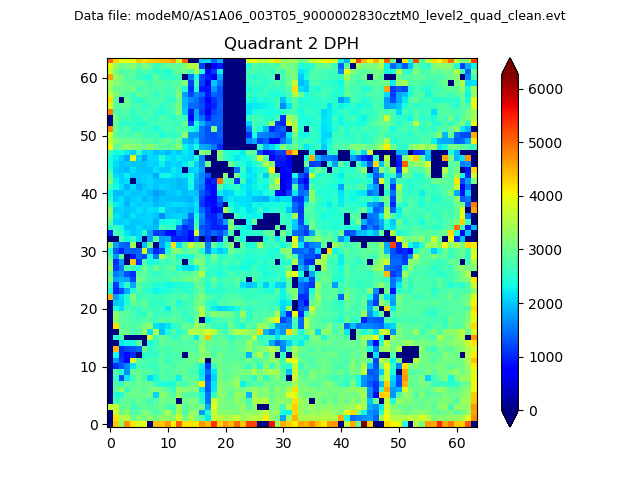 |
Quadrant C |
| Plot type | Count rate plots | Images |
|---|---|---|
| Comparison with Poisson distribution Blue bars denote a histogram of data divided into 1 sec bins. Red curve is a Poisson curve with rate = median count rate of data. |
 |
 |
| Quadrant-wise count rates Data is divided into 100 sec bins |
 |
|
| Module-wise count rates for Quadrant A Data is divided into 100 sec bins |
 |
 |
| Module-wise count rates for Quadrant B Data is divided into 100 sec bins |
 |
 |
| Module-wise count rates for Quadrant C Data is divided into 100 sec bins |
 |
 |
| Module-wise count rates for Quadrant D Data is divided into 100 sec bins |
 |
 |
| Parameter | Plot |
|---|---|
| CZT HV Monitor | 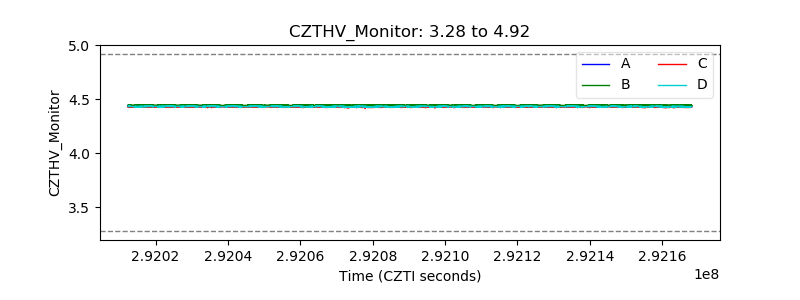 |
| D_VDD |  |
| Temperature 1 |  |
| Veto HV Monitor |  |
| Veto LLD |  |
| Alpha Counter |  |
| _CPM_Rate |  |
| CZT Counter |  |
| +2.5 Volts monitor |  |
| +5 Volts monitor |  |
| _ROLL_ROT |  |
| _Roll_DEC |  |
| _Roll_RA |  |
| Veto Counter | 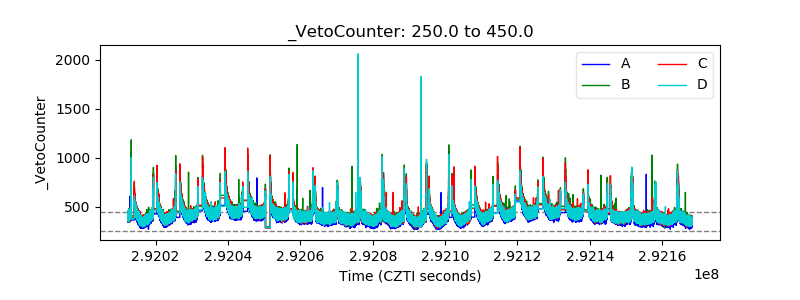 |