| Param | Original file | Final file |
|---|---|---|
| Filename | modeM0/AS1A05_166T04_9000002826cztM0_level2_bc.evt | modeM0/AS1A05_166T04_9000002826cztM0_level2_quad_clean.evt |
| Size (bytes) | 2,710,578,240 | 742,003,200 |
| Size | 2.5 GB | 707.6 MB |
| Events in quadrant A | 12,457,794 | 4,682,691 |
| Events in quadrant B | 19,182,905 | 4,736,713 |
| Events in quadrant C | 13,513,119 | 4,616,018 |
| Events in quadrant D | 32,914,557 | 4,386,585 |
| Mode SS | |||
|---|---|---|---|
| Quadrant | BADHDUFLAG | Total packets | Discarded packets |
| A | 0 | 1204 | 0 |
| B | 0 | 1204 | 0 |
| C | 0 | 1204 | 0 |
| D | 0 | 1204 | 0 |
| Mode M9 | |||
|---|---|---|---|
| Quadrant | BADHDUFLAG | Total packets | Discarded packets |
| A | 0 | 92 | 0 |
| B | 0 | 92 | 0 |
| C | 0 | 92 | 0 |
| D | 0 | 92 | 0 |
| Mode M0 | |||
|---|---|---|---|
| Quadrant | BADHDUFLAG | Total packets | Discarded packets |
| A | 0 | 122977 | 0 |
| B | 0 | 150206 | 0 |
| C | 0 | 127616 | 0 |
| D | 0 | 204917 | 0 |
| Quadrant | Total seconds | Saturated seconds | Saturation percentage |
|---|---|---|---|
| A | 59065 | 900 | 1.523745% |
| B | 59065 | 3149 | 5.331415% |
| C | 59065 | 1287 | 2.178955% |
| D | 59064 | 5773 | 9.774143% |
Noise dominated data is calculated using 1-second bins in cleaned event files. If a bin has >2000 counts, and if more than 50% of those come from <1% of pixels, then it is considered to be noise-dominated and hence unusable.
| Quadrant | # 1 sec bins | Bins with >0 counts | Bins with >2000 counts | High rate bins dominated by noise | Noise dominated (total time) | Noise dominated (detector-on time) | Marked lightcurve |
|---|---|---|---|---|---|---|---|
| A | 68310 | 59068 | 4 | 4 | 0.01% | 0.01% |  |
| B | 68310 | 59061 | 263 | 263 | 0.39% | 0.45% | 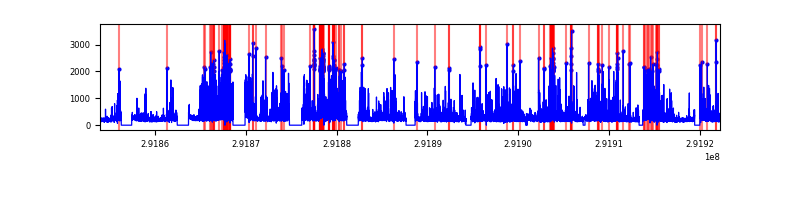 |
| C | 68310 | 59066 | 31 | 31 | 0.05% | 0.05% |  |
| D | 68310 | 59061 | 244 | 244 | 0.36% | 0.41% |  |
Top three noisy pixels from each quadrant. If the there are fewer than three noisy pixels in the level2.evt file, extra rows are filled as -1
| Pixel properties | Quadrant properties | ||||||
|---|---|---|---|---|---|---|---|
| Quadrant | DetID | PixID | Counts | Sigma | Mean | Median | Sigma |
| A | 5 | 98 | 73240 | 100.84 | 3191 | 3128 | 695.3 |
| A | 13 | 254 | 58605 | 79.79 | 3191 | 3128 | 695.3 |
| A | 11 | 29 | 48668 | 65.5 | 3191 | 3128 | 695.3 |
| B | 3 | 112 | 5733763 | 9617.29 | 3170 | 3093 | 595.9 |
| B | 7 | 220 | 674525 | 1126.81 | 3170 | 3093 | 595.9 |
| B | 4 | 216 | 124943 | 204.49 | 3170 | 3093 | 595.9 |
| C | 0 | 207 | 912679 | 1248.23 | 3107 | 3091 | 728.7 |
| C | 3 | 233 | 432569 | 589.38 | 3107 | 3091 | 728.7 |
| C | 8 | 208 | 85600 | 113.23 | 3107 | 3091 | 728.7 |
| D | 7 | 238 | 14851866 | 20920.89 | 3062 | 2952 | 709.8 |
| D | 1 | 52 | 2438913 | 3432.07 | 3062 | 2952 | 709.8 |
| D | 12 | 218 | 1952813 | 2747.19 | 3062 | 2952 | 709.8 |
Histogram calculated using DETX and DETY for each event in the final _common_clean file
| Quadrant A |  |
 |
Quadrant B |
|---|---|---|---|
| Quadrant D |  |
 |
Quadrant C |
| Plot type | Count rate plots | Images |
|---|---|---|
| Comparison with Poisson distribution Blue bars denote a histogram of data divided into 1 sec bins. Red curve is a Poisson curve with rate = median count rate of data. |
 |
 |
| Quadrant-wise count rates Data is divided into 100 sec bins |
 |
|
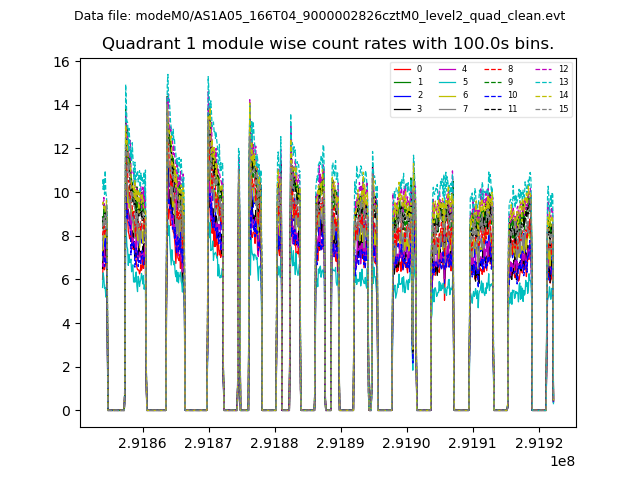
| Module-wise count rates for Quadrant A Data is divided into 100 sec bins |
 |
 |
| Module-wise count rates for Quadrant B Data is divided into 100 sec bins |
 |
 |
| Module-wise count rates for Quadrant C Data is divided into 100 sec bins |
 |
 |
| Module-wise count rates for Quadrant D Data is divided into 100 sec bins |
 |
 |
| Parameter | Plot |
|---|---|
| CZT HV Monitor |  |
| D_VDD | 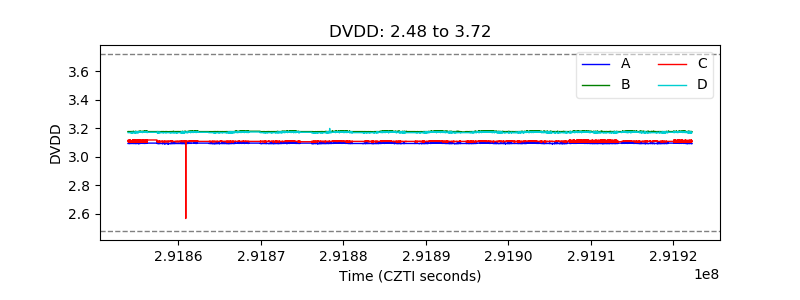 |
| Temperature 1 |  |
| Veto HV Monitor |  |
| Veto LLD |  |
| Alpha Counter |  |
| _CPM_Rate |  |
| CZT Counter |  |
| +2.5 Volts monitor |  |
| +5 Volts monitor |  |
| _ROLL_ROT |  |
| _Roll_DEC |  |
| _Roll_RA |  |
| Veto Counter |  |