| Param | Original file | Final file |
|---|---|---|
| Filename | modeM0/AS1A05_205T01_9000002824cztM0_level2_bc.evt | modeM0/AS1A05_205T01_9000002824cztM0_level2_quad_clean.evt |
| Size (bytes) | 4,920,543,360 | 1,456,554,240 |
| Size | 4.6 GB | 1.4 GB |
| Events in quadrant A | 32,931,064 | 9,019,060 |
| Events in quadrant B | 38,501,622 | 9,456,110 |
| Events in quadrant C | 22,179,687 | 9,353,199 |
| Events in quadrant D | 47,990,435 | 8,822,279 |
| Mode M9 | |||
|---|---|---|---|
| Quadrant | BADHDUFLAG | Total packets | Discarded packets |
| A | 0 | 151 | 0 |
| B | 0 | 151 | 0 |
| C | 0 | 151 | 0 |
| D | 0 | 151 | 0 |
| Mode SS | |||
|---|---|---|---|
| Quadrant | BADHDUFLAG | Total packets | Discarded packets |
| A | 0 | 2220 | 0 |
| B | 0 | 2220 | 0 |
| C | 0 | 2220 | 0 |
| D | 0 | 2220 | 0 |
| Mode M0 | |||
|---|---|---|---|
| Quadrant | BADHDUFLAG | Total packets | Discarded packets |
| A | 0 | 280438 | 0 |
| B | 0 | 290102 | 0 |
| C | 0 | 226233 | 0 |
| D | 0 | 329982 | 0 |
| Quadrant | Total seconds | Saturated seconds | Saturation percentage |
|---|---|---|---|
| A | 108899 | 8392 | 7.706223% |
| B | 108899 | 7395 | 6.790696% |
| C | 108899 | 1659 | 1.523430% |
| D | 108899 | 9775 | 8.976207% |
Noise dominated data is calculated using 1-second bins in cleaned event files. If a bin has >2000 counts, and if more than 50% of those come from <1% of pixels, then it is considered to be noise-dominated and hence unusable.
| Quadrant | # 1 sec bins | Bins with >0 counts | Bins with >2000 counts | High rate bins dominated by noise | Noise dominated (total time) | Noise dominated (detector-on time) | Marked lightcurve |
|---|---|---|---|---|---|---|---|
| A | 124034 | 108868 | 480 | 480 | 0.39% | 0.44% |  |
| B | 124034 | 108897 | 632 | 632 | 0.51% | 0.58% |  |
| C | 124034 | 108904 | 8 | 8 | 0.01% | 0.01% |  |
| D | 124034 | 108895 | 747 | 747 | 0.60% | 0.69% |  |
Top three noisy pixels from each quadrant. If the there are fewer than three noisy pixels in the level2.evt file, extra rows are filled as -1
| Pixel properties | Quadrant properties | ||||||
|---|---|---|---|---|---|---|---|
| Quadrant | DetID | PixID | Counts | Sigma | Mean | Median | Sigma |
| A | 14 | 235 | 11301244 | 9351.98 | 5516 | 5402 | 1207.9 |
| A | 6 | 16 | 197523 | 159.06 | 5516 | 5402 | 1207.9 |
| A | 13 | 254 | 107572 | 84.59 | 5516 | 5402 | 1207.9 |
| B | 3 | 112 | 13771485 | 12785.42 | 5656 | 5509 | 1076.7 |
| B | 7 | 220 | 1023924 | 945.87 | 5656 | 5509 | 1076.7 |
| B | 0 | 189 | 990687 | 915.0 | 5656 | 5509 | 1076.7 |
| C | 3 | 233 | 277687 | 204.82 | 5625 | 5598 | 1328.4 |
| C | 6 | 96 | 151539 | 109.86 | 5625 | 5598 | 1328.4 |
| C | 0 | 207 | 36192 | 23.03 | 5625 | 5598 | 1328.4 |
| D | 7 | 238 | 12310678 | 9570.13 | 5507 | 5309 | 1285.8 |
| D | 12 | 218 | 8137436 | 6324.52 | 5507 | 5309 | 1285.8 |
| D | 1 | 52 | 4391078 | 3410.9 | 5507 | 5309 | 1285.8 |
Histogram calculated using DETX and DETY for each event in the final _common_clean file
| Quadrant A |  |
 |
Quadrant B |
|---|---|---|---|
| Quadrant D |  |
 |
Quadrant C |
| Plot type | Count rate plots | Images |
|---|---|---|
| Comparison with Poisson distribution Blue bars denote a histogram of data divided into 1 sec bins. Red curve is a Poisson curve with rate = median count rate of data. |
 |
 |
| Quadrant-wise count rates Data is divided into 100 sec bins |
 |
|
| Module-wise count rates for Quadrant A Data is divided into 100 sec bins |
 |
 |
| Module-wise count rates for Quadrant B Data is divided into 100 sec bins |
 |
 |
| Module-wise count rates for Quadrant C Data is divided into 100 sec bins |
 |
 |
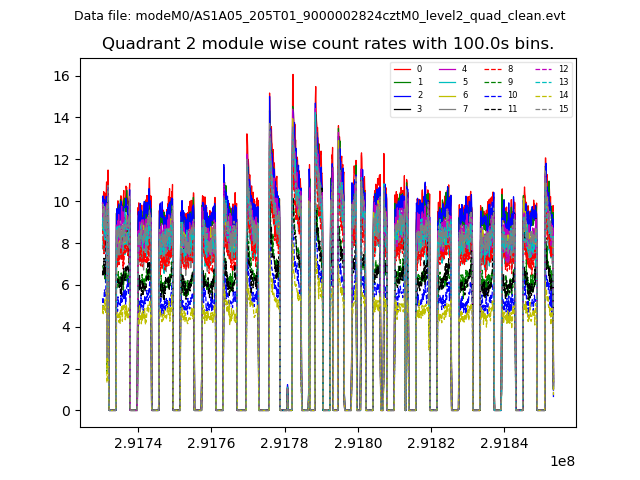
| Module-wise count rates for Quadrant D Data is divided into 100 sec bins |
 |
 |
| Parameter | Plot |
|---|---|
| CZT HV Monitor |  |
| D_VDD |  |
| Temperature 1 |  |
| Veto HV Monitor |  |
| Veto LLD |  |
| Alpha Counter |  |
| _CPM_Rate | 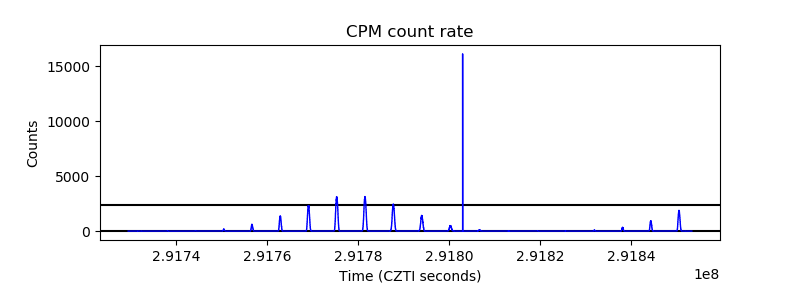 |
| CZT Counter |  |
| +2.5 Volts monitor | 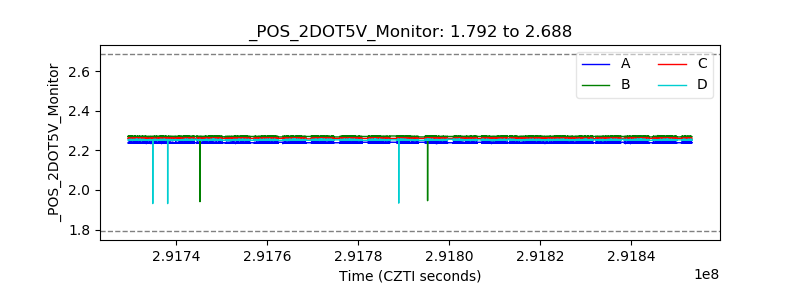 |
| +5 Volts monitor |  |
| _ROLL_ROT | 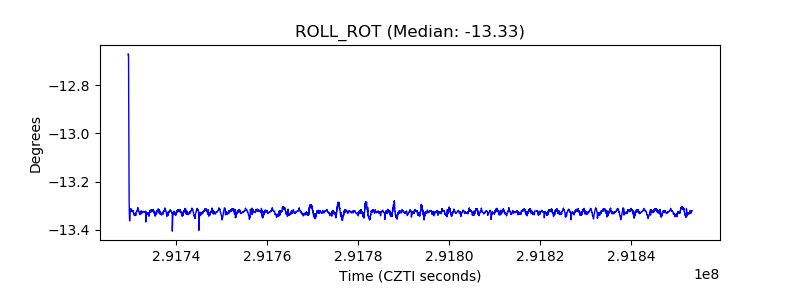 |
| _Roll_DEC |  |
| _Roll_RA | 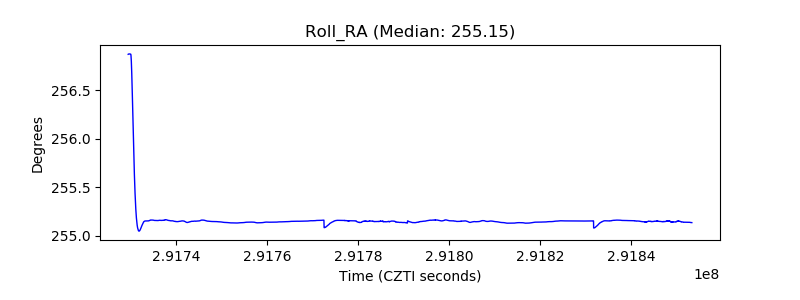 |
| Veto Counter |  |