| Param | Original file | Final file |
|---|---|---|
| Filename | modeM0/AS1T03_090T01_9000002822cztM0_level2_bc.evt | modeM0/AS1T03_090T01_9000002822cztM0_level2_quad_clean.evt |
| Size (bytes) | 2,651,368,320 | 714,447,360 |
| Size | 2.5 GB | 681.4 MB |
| Events in quadrant A | 24,476,743 | 4,433,586 |
| Events in quadrant B | 15,842,053 | 4,920,894 |
| Events in quadrant C | 9,912,792 | 4,854,742 |
| Events in quadrant D | 26,909,663 | 4,248,495 |
| Mode SS | |||
|---|---|---|---|
| Quadrant | BADHDUFLAG | Total packets | Discarded packets |
| A | 0 | 944 | 0 |
| B | 0 | 944 | 0 |
| C | 0 | 944 | 0 |
| D | 0 | 944 | 0 |
| Mode M9 | |||
|---|---|---|---|
| Quadrant | BADHDUFLAG | Total packets | Discarded packets |
| A | 0 | 103 | 0 |
| B | 0 | 104 | 0 |
| C | 0 | 104 | 0 |
| D | 0 | 104 | 0 |
| Mode M0 | |||
|---|---|---|---|
| Quadrant | BADHDUFLAG | Total packets | Discarded packets |
| A | 0 | 163498 | 0 |
| B | 0 | 118331 | 0 |
| C | 0 | 96651 | 0 |
| D | 0 | 186428 | 0 |
| Quadrant | Total seconds | Saturated seconds | Saturation percentage |
|---|---|---|---|
| A | 46279 | 8536 | 18.444651% |
| B | 46278 | 2058 | 4.447037% |
| C | 46279 | 667 | 1.441258% |
| D | 46279 | 10532 | 22.757622% |
Noise dominated data is calculated using 1-second bins in cleaned event files. If a bin has >2000 counts, and if more than 50% of those come from <1% of pixels, then it is considered to be noise-dominated and hence unusable.
| Quadrant | # 1 sec bins | Bins with >0 counts | Bins with >2000 counts | High rate bins dominated by noise | Noise dominated (total time) | Noise dominated (detector-on time) | Marked lightcurve |
|---|---|---|---|---|---|---|---|
| A | 60816 | 46255 | 597 | 597 | 0.98% | 1.29% |  |
| B | 60816 | 46275 | 266 | 266 | 0.44% | 0.57% |  |
| C | 60817 | 46279 | 1 | 1 | 0.00% | 0.00% |  |
| D | 60817 | 46274 | 148 | 148 | 0.24% | 0.32% |  |
Top three noisy pixels from each quadrant. If the there are fewer than three noisy pixels in the level2.evt file, extra rows are filled as -1
| Pixel properties | Quadrant properties | ||||||
|---|---|---|---|---|---|---|---|
| Quadrant | DetID | PixID | Counts | Sigma | Mean | Median | Sigma |
| A | 14 | 235 | 15188678 | 29913.36 | 2363 | 2332 | 507.7 |
| A | 6 | 16 | 103778 | 199.82 | 2363 | 2332 | 507.7 |
| A | 13 | 254 | 53832 | 101.44 | 2363 | 2332 | 507.7 |
| B | 3 | 112 | 4427535 | 9271.64 | 2579 | 2526 | 477.3 |
| B | 0 | 189 | 552176 | 1151.67 | 2579 | 2526 | 477.3 |
| B | 7 | 220 | 482678 | 1006.05 | 2579 | 2526 | 477.3 |
| C | 3 | 233 | 195038 | 329.01 | 2508 | 2510 | 585.2 |
| C | 0 | 207 | 55424 | 90.42 | 2508 | 2510 | 585.2 |
| C | 8 | 128 | 15142 | 21.59 | 2508 | 2510 | 585.2 |
| D | 7 | 238 | 14531876 | 27335.48 | 2309 | 2239 | 531.5 |
| D | 12 | 218 | 1960927 | 3685.0 | 2309 | 2239 | 531.5 |
| D | 12 | 233 | 623866 | 1169.5 | 2309 | 2239 | 531.5 |
Histogram calculated using DETX and DETY for each event in the final _common_clean file
| Quadrant A | 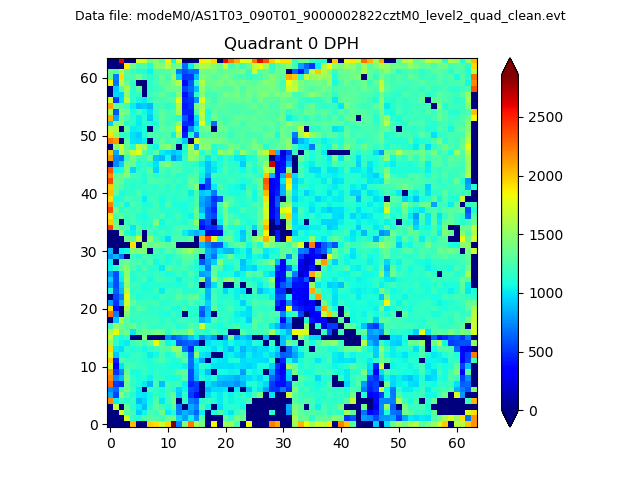 |
 |
Quadrant B |
|---|---|---|---|
| Quadrant D |  |
 |
Quadrant C |
| Plot type | Count rate plots | Images |
|---|---|---|
| Comparison with Poisson distribution Blue bars denote a histogram of data divided into 1 sec bins. Red curve is a Poisson curve with rate = median count rate of data. |
 |
 |
| Quadrant-wise count rates Data is divided into 100 sec bins |
 |
|
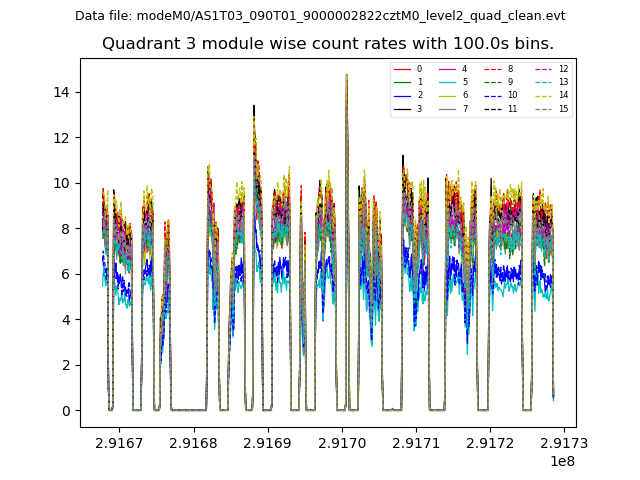
| Module-wise count rates for Quadrant A Data is divided into 100 sec bins |
 |
 |
| Module-wise count rates for Quadrant B Data is divided into 100 sec bins |
 |
 |
| Module-wise count rates for Quadrant C Data is divided into 100 sec bins |
 |
 |
| Module-wise count rates for Quadrant D Data is divided into 100 sec bins |
 |
 |
| Parameter | Plot |
|---|---|
| CZT HV Monitor |  |
| D_VDD |  |
| Temperature 1 |  |
| Veto HV Monitor |  |
| Veto LLD |  |
| Alpha Counter | 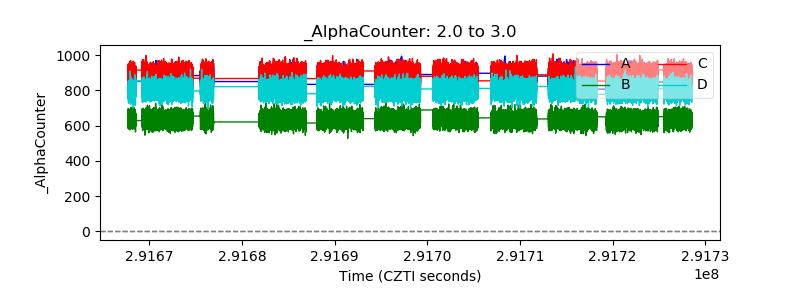 |
| _CPM_Rate |  |
| CZT Counter |  |
| +2.5 Volts monitor |  |
| +5 Volts monitor |  |
| _ROLL_ROT |  |
| _Roll_DEC | 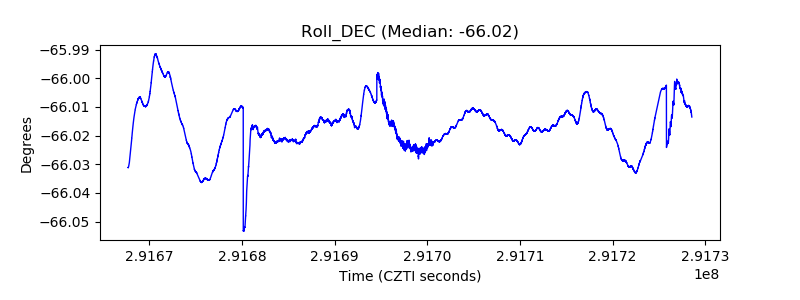 |
| _Roll_RA |  |
| Veto Counter |  |