| Param | Original file | Final file |
|---|---|---|
| Filename | modeM0/AS1A05_163T01_9000002820cztM0_level2_bc.evt | modeM0/AS1A05_163T01_9000002820cztM0_level2_quad_clean.evt |
| Size (bytes) | 11,187,319,680 | 2,508,831,360 |
| Size | 10.4 GB | 2.3 GB |
| Events in quadrant A | 109,017,586 | 13,628,494 |
| Events in quadrant B | 85,319,191 | 16,291,060 |
| Events in quadrant C | 46,695,102 | 16,342,340 |
| Events in quadrant D | 83,719,620 | 15,564,146 |
| Mode M0 | |||
|---|---|---|---|
| Quadrant | BADHDUFLAG | Total packets | Discarded packets |
| A | 0 | 805364 | 0 |
| B | 0 | 604241 | 0 |
| C | 0 | 442533 | 0 |
| D | 0 | 588796 | 0 |
| Mode SS | |||
|---|---|---|---|
| Quadrant | BADHDUFLAG | Total packets | Discarded packets |
| A | 0 | 4208 | 0 |
| B | 0 | 4208 | 0 |
| C | 0 | 4208 | 0 |
| D | 0 | 4208 | 0 |
| Mode M9 | |||
|---|---|---|---|
| Quadrant | BADHDUFLAG | Total packets | Discarded packets |
| A | 0 | 330 | 0 |
| B | 0 | 330 | 0 |
| C | 0 | 330 | 0 |
| D | 0 | 330 | 0 |
| Quadrant | Total seconds | Saturated seconds | Saturation percentage |
|---|---|---|---|
| A | 206480 | 54242 | 26.269857% |
| B | 206480 | 20395 | 9.877470% |
| C | 206480 | 3605 | 1.745932% |
| D | 206480 | 15544 | 7.528090% |
Noise dominated data is calculated using 1-second bins in cleaned event files. If a bin has >2000 counts, and if more than 50% of those come from <1% of pixels, then it is considered to be noise-dominated and hence unusable.
| Quadrant | # 1 sec bins | Bins with >0 counts | Bins with >2000 counts | High rate bins dominated by noise | Noise dominated (total time) | Noise dominated (detector-on time) | Marked lightcurve |
|---|---|---|---|---|---|---|---|
| A | 239462 | 206274 | 2557 | 2557 | 1.07% | 1.24% |  |
| B | 239462 | 206455 | 2000 | 2000 | 0.84% | 0.97% |  |
| C | 239462 | 206489 | 9 | 9 | 0.00% | 0.00% |  |
| D | 239462 | 206477 | 1215 | 1215 | 0.51% | 0.59% |  |
Top three noisy pixels from each quadrant. If the there are fewer than three noisy pixels in the level2.evt file, extra rows are filled as -1
| Pixel properties | Quadrant properties | ||||||
|---|---|---|---|---|---|---|---|
| Quadrant | DetID | PixID | Counts | Sigma | Mean | Median | Sigma |
| A | 14 | 235 | 72415263 | 35640.86 | 9355 | 9182 | 2031.5 |
| A | 13 | 254 | 244520 | 115.84 | 9355 | 9182 | 2031.5 |
| A | 15 | 174 | 195216 | 91.57 | 9355 | 9182 | 2031.5 |
| B | 3 | 112 | 38105031 | 19256.47 | 10653 | 10388 | 1978.3 |
| B | 7 | 220 | 1744712 | 876.68 | 10653 | 10388 | 1978.3 |
| B | 0 | 189 | 1241632 | 622.38 | 10653 | 10388 | 1978.3 |
| C | 3 | 233 | 5252320 | 2132.33 | 10617 | 10570 | 2458.2 |
| C | 6 | 96 | 187722 | 72.06 | 10617 | 10570 | 2458.2 |
| C | 5 | 112 | 149974 | 56.71 | 10617 | 10570 | 2458.2 |
| D | 7 | 238 | 26975137 | 11153.29 | 10526 | 10153 | 2417.7 |
| D | 1 | 52 | 7783892 | 3215.38 | 10526 | 10153 | 2417.7 |
| D | 12 | 218 | 2628655 | 1083.07 | 10526 | 10153 | 2417.7 |
Histogram calculated using DETX and DETY for each event in the final _common_clean file
| Quadrant A |  |
 |
Quadrant B |
|---|---|---|---|
| Quadrant D |  |
 |
Quadrant C |
| Plot type | Count rate plots | Images |
|---|---|---|
| Comparison with Poisson distribution Blue bars denote a histogram of data divided into 1 sec bins. Red curve is a Poisson curve with rate = median count rate of data. |
 |
 |
| Quadrant-wise count rates Data is divided into 100 sec bins |
 |
|
| Module-wise count rates for Quadrant A Data is divided into 100 sec bins |
 |
 |
| Module-wise count rates for Quadrant B Data is divided into 100 sec bins |
 |
 |
| Module-wise count rates for Quadrant C Data is divided into 100 sec bins |
 |
 |
| Module-wise count rates for Quadrant D Data is divided into 100 sec bins |
 |
 |
| Parameter | Plot |
|---|---|
| CZT HV Monitor |  |
| D_VDD | 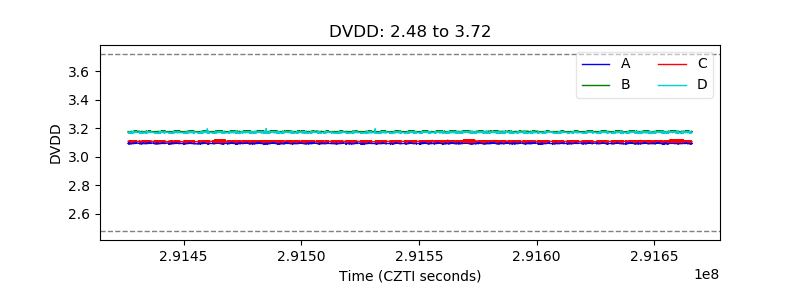 |
| Temperature 1 |  |
| Veto HV Monitor |  |
| Veto LLD |  |
| Alpha Counter |  |
| _CPM_Rate |  |
| CZT Counter |  |
| +2.5 Volts monitor |  |
| +5 Volts monitor |  |
| _ROLL_ROT |  |
| _Roll_DEC |  |
| _Roll_RA |  |
| Veto Counter |  |