| Param | Original file | Final file |
|---|---|---|
| Filename | modeM0/AS1A06_003T07_9000002818cztM0_level2_bc.evt | modeM0/AS1A06_003T07_9000002818cztM0_level2_quad_clean.evt |
| Size (bytes) | 4,805,196,480 | 1,518,963,840 |
| Size | 4.5 GB | 1.4 GB |
| Events in quadrant A | 32,873,288 | 9,917,146 |
| Events in quadrant B | 41,605,477 | 9,391,499 |
| Events in quadrant C | 22,773,737 | 9,696,182 |
| Events in quadrant D | 40,688,785 | 9,366,181 |
| Mode SS | |||
|---|---|---|---|
| Quadrant | BADHDUFLAG | Total packets | Discarded packets |
| A | 0 | 2270 | 0 |
| B | 0 | 2270 | 0 |
| C | 0 | 2270 | 0 |
| D | 0 | 2270 | 0 |
| Mode M9 | |||
|---|---|---|---|
| Quadrant | BADHDUFLAG | Total packets | Discarded packets |
| A | 0 | 154 | 0 |
| B | 0 | 154 | 0 |
| C | 0 | 154 | 0 |
| D | 0 | 154 | 0 |
| Mode M0 | |||
|---|---|---|---|
| Quadrant | BADHDUFLAG | Total packets | Discarded packets |
| A | 0 | 259556 | 0 |
| B | 0 | 317148 | 0 |
| C | 0 | 231947 | 0 |
| D | 0 | 288481 | 0 |
| Quadrant | Total seconds | Saturated seconds | Saturation percentage |
|---|---|---|---|
| A | 111382 | 3411 | 3.062434% |
| B | 111382 | 12285 | 11.029610% |
| C | 111382 | 1990 | 1.786644% |
| D | 111382 | 4445 | 3.990771% |
Noise dominated data is calculated using 1-second bins in cleaned event files. If a bin has >2000 counts, and if more than 50% of those come from <1% of pixels, then it is considered to be noise-dominated and hence unusable.
| Quadrant | # 1 sec bins | Bins with >0 counts | Bins with >2000 counts | High rate bins dominated by noise | Noise dominated (total time) | Noise dominated (detector-on time) | Marked lightcurve |
|---|---|---|---|---|---|---|---|
| A | 126331 | 111386 | 1069 | 1069 | 0.85% | 0.96% | 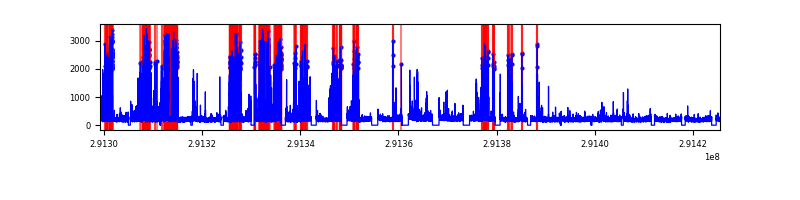 |
| B | 126331 | 111295 | 852 | 852 | 0.67% | 0.77% |  |
| C | 126331 | 111388 | 67 | 67 | 0.05% | 0.06% |  |
| D | 126331 | 111385 | 1008 | 1008 | 0.80% | 0.90% |  |
Top three noisy pixels from each quadrant. If the there are fewer than three noisy pixels in the level2.evt file, extra rows are filled as -1
| Pixel properties | Quadrant properties | ||||||
|---|---|---|---|---|---|---|---|
| Quadrant | DetID | PixID | Counts | Sigma | Mean | Median | Sigma |
| A | 6 | 16 | 10290936 | 8242.64 | 5759 | 5656 | 1247.8 |
| A | 13 | 254 | 150337 | 115.95 | 5759 | 5656 | 1247.8 |
| A | 0 | 13 | 102110 | 77.3 | 5759 | 5656 | 1247.8 |
| B | 3 | 112 | 16974304 | 16293.06 | 5517 | 5389 | 1041.5 |
| B | 7 | 220 | 987845 | 943.33 | 5517 | 5389 | 1041.5 |
| B | 0 | 189 | 928722 | 886.56 | 5517 | 5389 | 1041.5 |
| C | 3 | 233 | 583617 | 442.03 | 5576 | 5542 | 1307.8 |
| C | 12 | 4 | 427762 | 322.85 | 5576 | 5542 | 1307.8 |
| C | 9 | 54 | 181969 | 134.91 | 5576 | 5542 | 1307.8 |
| D | 1 | 52 | 4985035 | 3756.67 | 5657 | 5457 | 1325.5 |
| D | 7 | 238 | 3214406 | 2420.88 | 5657 | 5457 | 1325.5 |
| D | 12 | 110 | 2890362 | 2176.42 | 5657 | 5457 | 1325.5 |
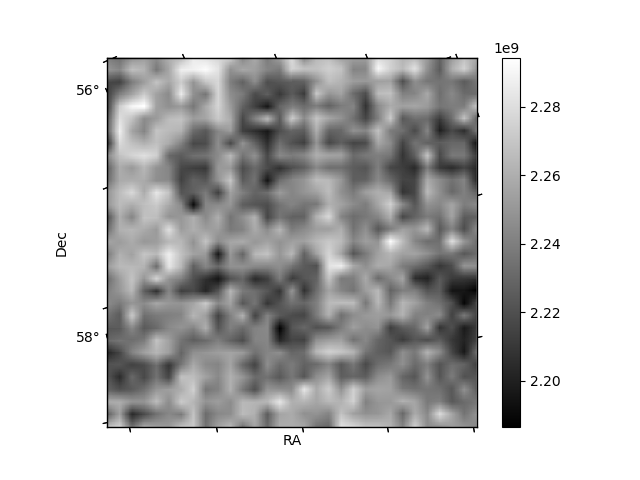
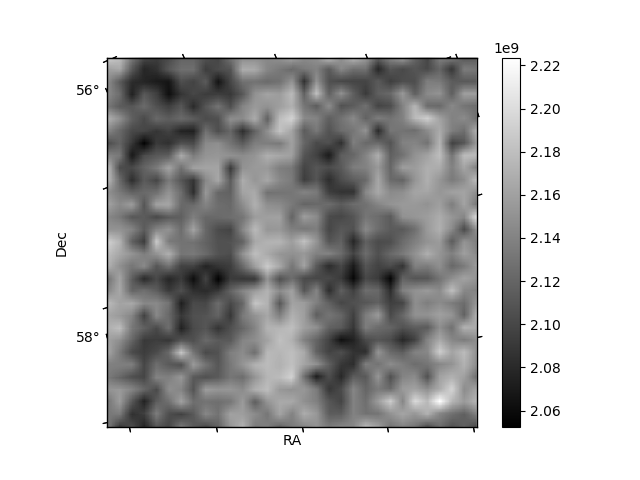
Histogram calculated using DETX and DETY for each event in the final _common_clean file
| Quadrant A |  |
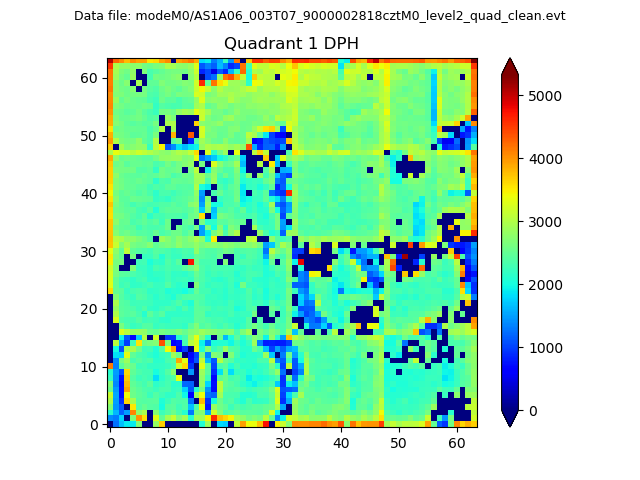 |
Quadrant B |
|---|---|---|---|
| Quadrant D |  |
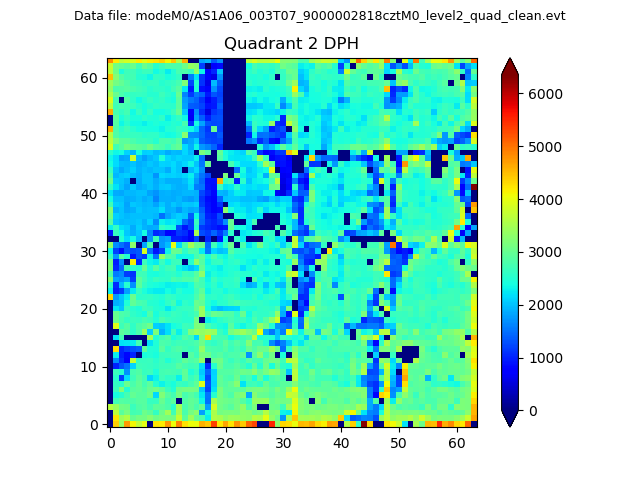 |
Quadrant C |
| Plot type | Count rate plots | Images |
|---|---|---|
| Comparison with Poisson distribution Blue bars denote a histogram of data divided into 1 sec bins. Red curve is a Poisson curve with rate = median count rate of data. |
 |
 |
| Quadrant-wise count rates Data is divided into 100 sec bins |
 |
|
| Module-wise count rates for Quadrant A Data is divided into 100 sec bins |
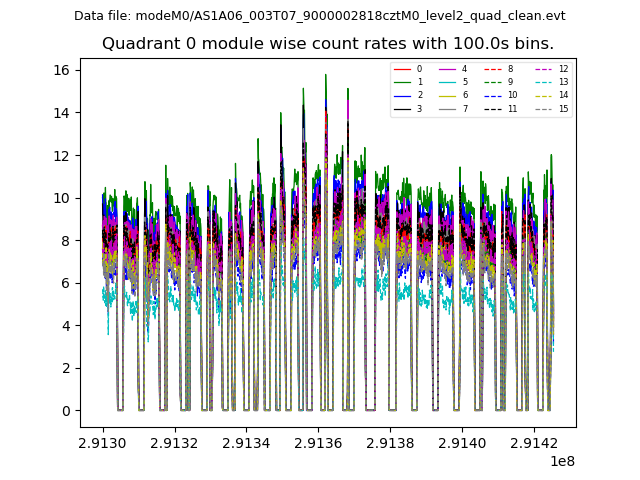 |
 |
| Module-wise count rates for Quadrant B Data is divided into 100 sec bins |
 |
 |
| Module-wise count rates for Quadrant C Data is divided into 100 sec bins |
 |
 |
| Module-wise count rates for Quadrant D Data is divided into 100 sec bins |
 |
 |
| Parameter | Plot |
|---|---|
| CZT HV Monitor |  |
| D_VDD |  |
| Temperature 1 |  |
| Veto HV Monitor |  |
| Veto LLD |  |
| Alpha Counter |  |
| _CPM_Rate |  |
| CZT Counter |  |
| +2.5 Volts monitor |  |
| +5 Volts monitor | 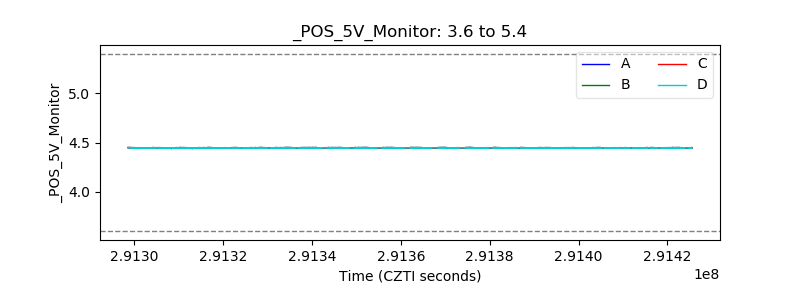 |
| _ROLL_ROT |  |
| _Roll_DEC |  |
| _Roll_RA |  |
| Veto Counter |  |