| Param | Original file | Final file |
|---|---|---|
| Filename | modeM0/AS1T03_094T01_9000002816cztM0_level2_bc.evt | modeM0/AS1T03_094T01_9000002816cztM0_level2_quad_clean.evt |
| Size (bytes) | 6,038,282,880 | 1,932,768,000 |
| Size | 5.6 GB | 1.8 GB |
| Events in quadrant A | 39,089,049 | 12,273,346 |
| Events in quadrant B | 36,473,237 | 12,572,671 |
| Events in quadrant C | 34,892,630 | 11,978,110 |
| Events in quadrant D | 62,184,975 | 11,418,631 |
| Mode M9 | |||
|---|---|---|---|
| Quadrant | BADHDUFLAG | Total packets | Discarded packets |
| A | 0 | 238 | 0 |
| B | 0 | 238 | 0 |
| C | 0 | 238 | 0 |
| D | 0 | 238 | 0 |
| Mode SS | |||
|---|---|---|---|
| Quadrant | BADHDUFLAG | Total packets | Discarded packets |
| A | 0 | 3064 | 0 |
| B | 0 | 3064 | 0 |
| C | 0 | 3064 | 0 |
| D | 0 | 3064 | 0 |
| Mode M0 | |||
|---|---|---|---|
| Quadrant | BADHDUFLAG | Total packets | Discarded packets |
| A | 0 | 333738 | 0 |
| B | 0 | 332554 | 0 |
| C | 0 | 326579 | 0 |
| D | 0 | 423929 | 0 |
| Quadrant | Total seconds | Saturated seconds | Saturation percentage |
|---|---|---|---|
| A | 150323 | 3517 | 2.339629% |
| B | 150323 | 2773 | 1.844694% |
| C | 150323 | 3244 | 2.158020% |
| D | 150323 | 9240 | 6.146764% |
Noise dominated data is calculated using 1-second bins in cleaned event files. If a bin has >2000 counts, and if more than 50% of those come from <1% of pixels, then it is considered to be noise-dominated and hence unusable.
| Quadrant | # 1 sec bins | Bins with >0 counts | Bins with >2000 counts | High rate bins dominated by noise | Noise dominated (total time) | Noise dominated (detector-on time) | Marked lightcurve |
|---|---|---|---|---|---|---|---|
| A | 173867 | 150328 | 1075 | 1075 | 0.62% | 0.72% | 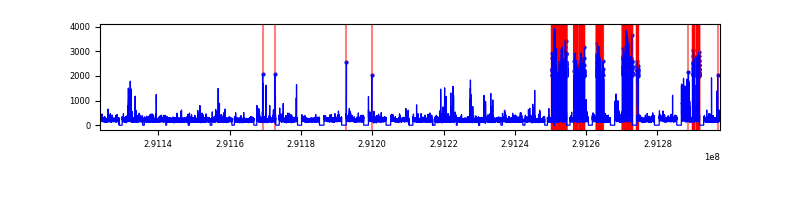 |
| B | 173867 | 150326 | 43 | 43 | 0.02% | 0.03% | 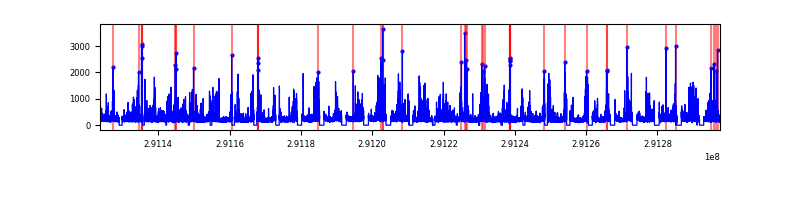 |
| C | 173868 | 150330 | 228 | 228 | 0.13% | 0.15% | 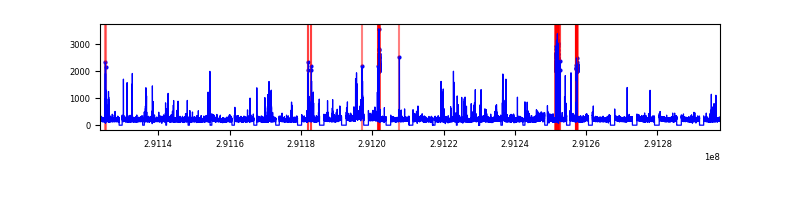 |
| D | 173867 | 150314 | 1352 | 1352 | 0.78% | 0.90% |  |
Top three noisy pixels from each quadrant. If the there are fewer than three noisy pixels in the level2.evt file, extra rows are filled as -1
| Pixel properties | Quadrant properties | ||||||
|---|---|---|---|---|---|---|---|
| Quadrant | DetID | PixID | Counts | Sigma | Mean | Median | Sigma |
| A | 6 | 16 | 7095108 | 4041.07 | 8064 | 7915 | 1753.8 |
| A | 0 | 13 | 322017 | 179.1 | 8064 | 7915 | 1753.8 |
| A | 13 | 254 | 216911 | 119.17 | 8064 | 7915 | 1753.8 |
| B | 7 | 220 | 2049776 | 1315.6 | 8159 | 7957 | 1552.0 |
| B | 4 | 216 | 555343 | 352.69 | 8159 | 7957 | 1552.0 |
| B | 10 | 245 | 405589 | 256.2 | 8159 | 7957 | 1552.0 |
| C | 3 | 233 | 4268859 | 2355.25 | 7750 | 7693 | 1809.2 |
| C | 0 | 207 | 487721 | 265.32 | 7750 | 7693 | 1809.2 |
| C | 5 | 112 | 275383 | 147.96 | 7750 | 7693 | 1809.2 |
| D | 12 | 1 | 8151187 | 4528.99 | 7735 | 7456 | 1798.1 |
| D | 7 | 238 | 7208098 | 4004.51 | 7735 | 7456 | 1798.1 |
| D | 1 | 52 | 6688948 | 3715.79 | 7735 | 7456 | 1798.1 |
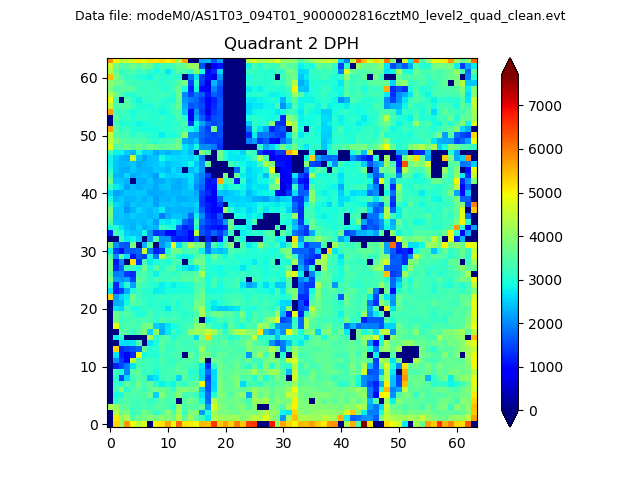
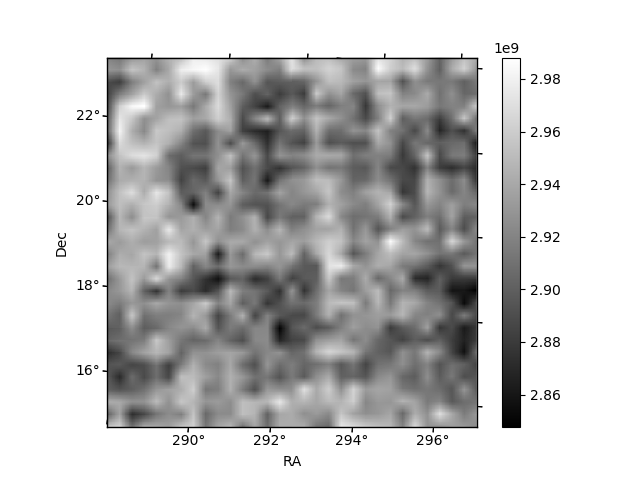
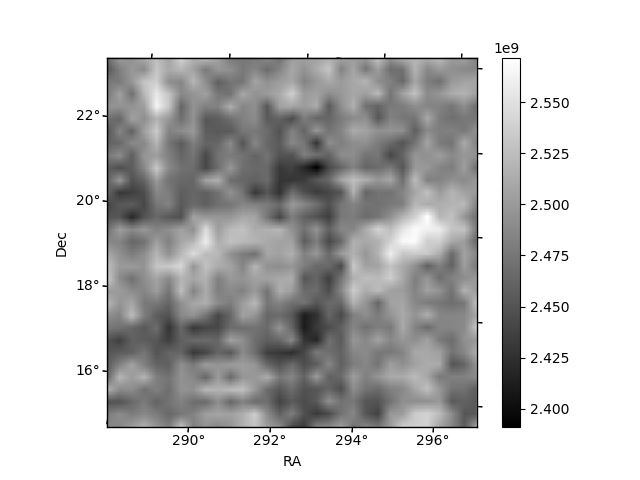
Histogram calculated using DETX and DETY for each event in the final _common_clean file
| Quadrant A |  |
 |
Quadrant B |
|---|---|---|---|
| Quadrant D |  |
 |
Quadrant C |
| Plot type | Count rate plots | Images |
|---|---|---|
| Comparison with Poisson distribution Blue bars denote a histogram of data divided into 1 sec bins. Red curve is a Poisson curve with rate = median count rate of data. |
 |
 |
| Quadrant-wise count rates Data is divided into 100 sec bins |
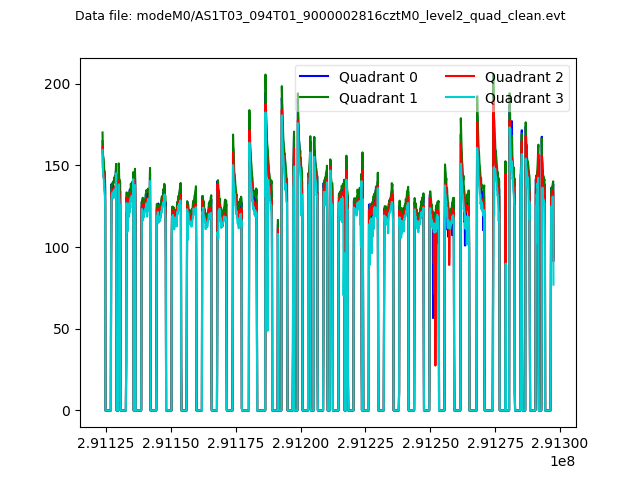 |
|
| Module-wise count rates for Quadrant A Data is divided into 100 sec bins |
 |
 |
| Module-wise count rates for Quadrant B Data is divided into 100 sec bins |
 |
 |
| Module-wise count rates for Quadrant C Data is divided into 100 sec bins |
 |
 |
| Module-wise count rates for Quadrant D Data is divided into 100 sec bins |
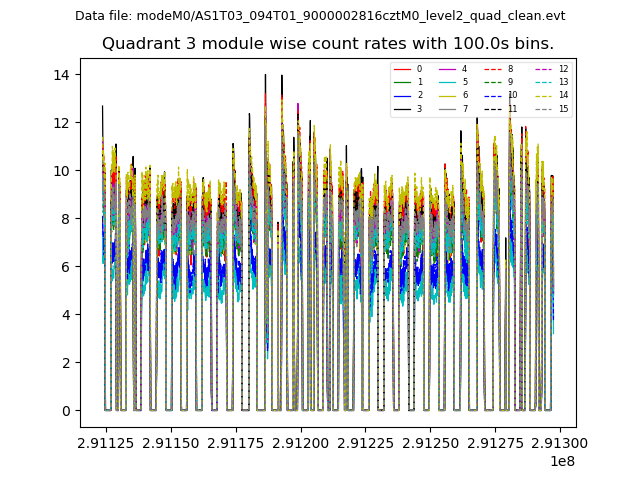 |
 |
| Parameter | Plot |
|---|---|
| CZT HV Monitor |  |
| D_VDD |  |
| Temperature 1 |  |
| Veto HV Monitor | 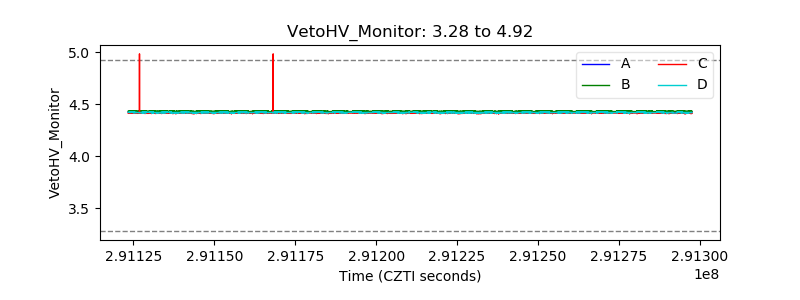 |
| Veto LLD |  |
| Alpha Counter | 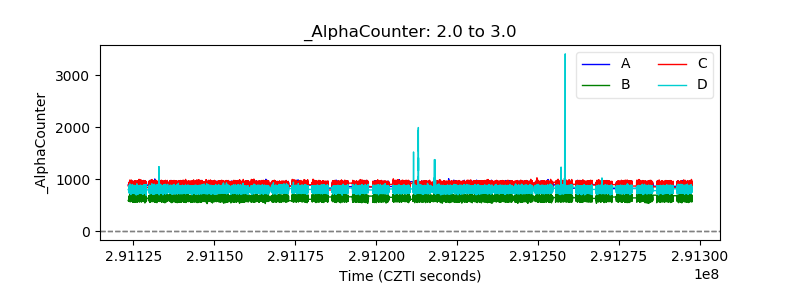 |
| _CPM_Rate |  |
| CZT Counter | 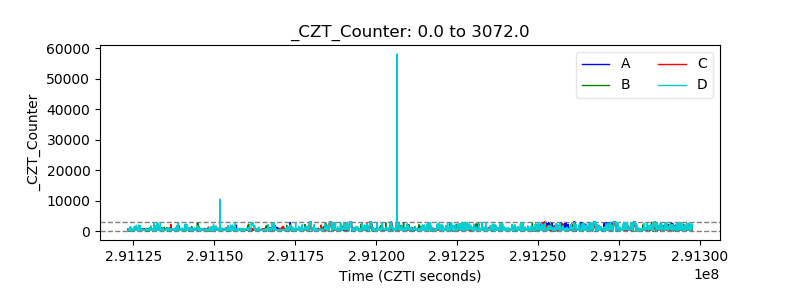 |
| +2.5 Volts monitor |  |
| +5 Volts monitor |  |
| _ROLL_ROT |  |
| _Roll_DEC | 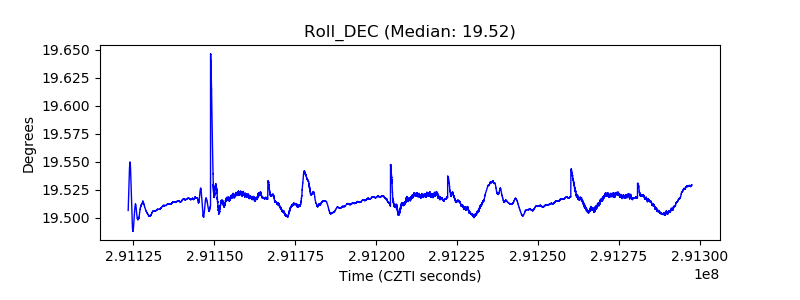 |
| _Roll_RA |  |
| Veto Counter |  |