| Param | Original file | Final file |
|---|---|---|
| Filename | modeM0/AS1A05_194T13_9000002814cztM0_level2_bc.evt | modeM0/AS1A05_194T13_9000002814cztM0_level2_quad_clean.evt |
| Size (bytes) | 1,120,213,440 | 366,920,640 |
| Size | 1.0 GB | 349.9 MB |
| Events in quadrant A | 6,671,037 | 2,363,926 |
| Events in quadrant B | 8,363,666 | 2,376,781 |
| Events in quadrant C | 6,567,639 | 2,233,855 |
| Events in quadrant D | 10,351,269 | 2,152,732 |
| Mode M0 | |||
|---|---|---|---|
| Quadrant | BADHDUFLAG | Total packets | Discarded packets |
| A | 0 | 61012 | 0 |
| B | 0 | 67621 | 0 |
| C | 0 | 61708 | 0 |
| D | 0 | 75364 | 0 |
| Mode SS | |||
|---|---|---|---|
| Quadrant | BADHDUFLAG | Total packets | Discarded packets |
| A | 0 | 588 | 0 |
| B | 0 | 588 | 0 |
| C | 0 | 588 | 0 |
| D | 0 | 588 | 0 |
| Mode M9 | |||
|---|---|---|---|
| Quadrant | BADHDUFLAG | Total packets | Discarded packets |
| A | 0 | 62 | 0 |
| B | 0 | 62 | 0 |
| C | 0 | 62 | 0 |
| D | 0 | 62 | 0 |
| Quadrant | Total seconds | Saturated seconds | Saturation percentage |
|---|---|---|---|
| A | 28890 | 162 | 0.560748% |
| B | 28890 | 361 | 1.249567% |
| C | 28890 | 275 | 0.951886% |
| D | 28890 | 1027 | 3.554863% |
Noise dominated data is calculated using 1-second bins in cleaned event files. If a bin has >2000 counts, and if more than 50% of those come from <1% of pixels, then it is considered to be noise-dominated and hence unusable.
| Quadrant | # 1 sec bins | Bins with >0 counts | Bins with >2000 counts | High rate bins dominated by noise | Noise dominated (total time) | Noise dominated (detector-on time) | Marked lightcurve |
|---|---|---|---|---|---|---|---|
| A | 35161 | 28890 | 1 | 1 | 0.00% | 0.00% |  |
| B | 35161 | 28891 | 9 | 9 | 0.03% | 0.03% |  |
| C | 35161 | 28891 | 4 | 4 | 0.01% | 0.01% |  |
| D | 35161 | 28890 | 144 | 144 | 0.41% | 0.50% |  |
Top three noisy pixels from each quadrant. If the there are fewer than three noisy pixels in the level2.evt file, extra rows are filled as -1
| Pixel properties | Quadrant properties | ||||||
|---|---|---|---|---|---|---|---|
| Quadrant | DetID | PixID | Counts | Sigma | Mean | Median | Sigma |
| A | 13 | 254 | 42325 | 112.66 | 1697 | 1672 | 360.9 |
| A | 11 | 29 | 34888 | 92.05 | 1697 | 1672 | 360.9 |
| A | 9 | 143 | 29915 | 78.27 | 1697 | 1672 | 360.9 |
| B | 10 | 245 | 1124067 | 3572.07 | 1707 | 1675 | 314.2 |
| B | 7 | 220 | 205239 | 647.85 | 1707 | 1675 | 314.2 |
| B | 0 | 197 | 100317 | 313.93 | 1707 | 1675 | 314.2 |
| C | 3 | 233 | 192487 | 518.88 | 1595 | 1595 | 367.9 |
| C | 0 | 207 | 131503 | 353.11 | 1595 | 1595 | 367.9 |
| C | 5 | 112 | 93371 | 249.46 | 1595 | 1595 | 367.9 |
| D | 1 | 52 | 1507573 | 4101.12 | 1614 | 1559 | 367.2 |
| D | 1 | 20 | 1497647 | 4074.09 | 1614 | 1559 | 367.2 |
| D | 12 | 1 | 585646 | 1590.56 | 1614 | 1559 | 367.2 |
Histogram calculated using DETX and DETY for each event in the final _common_clean file
| Quadrant A |  |
 |
Quadrant B |
|---|---|---|---|
| Quadrant D |  |
 |
Quadrant C |
| Plot type | Count rate plots | Images |
|---|---|---|
| Comparison with Poisson distribution Blue bars denote a histogram of data divided into 1 sec bins. Red curve is a Poisson curve with rate = median count rate of data. |
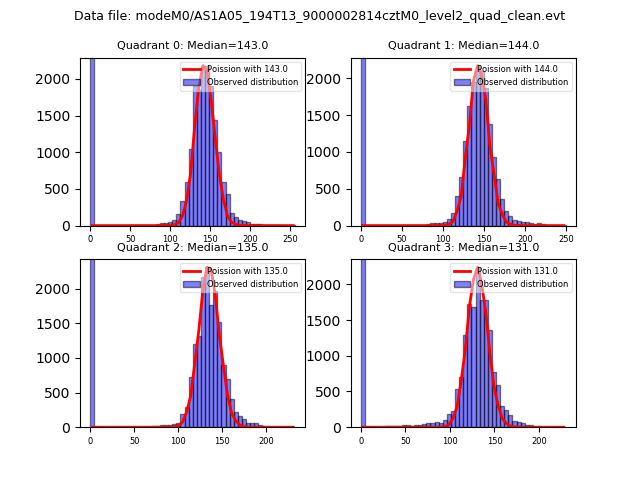 |
 |
| Quadrant-wise count rates Data is divided into 100 sec bins |
 |
|
| Module-wise count rates for Quadrant A Data is divided into 100 sec bins |
 |
 |
| Module-wise count rates for Quadrant B Data is divided into 100 sec bins |
 |
 |
| Module-wise count rates for Quadrant C Data is divided into 100 sec bins |
 |
 |
| Module-wise count rates for Quadrant D Data is divided into 100 sec bins |
 |
 |
| Parameter | Plot |
|---|---|
| CZT HV Monitor |  |
| D_VDD |  |
| Temperature 1 |  |
| Veto HV Monitor | 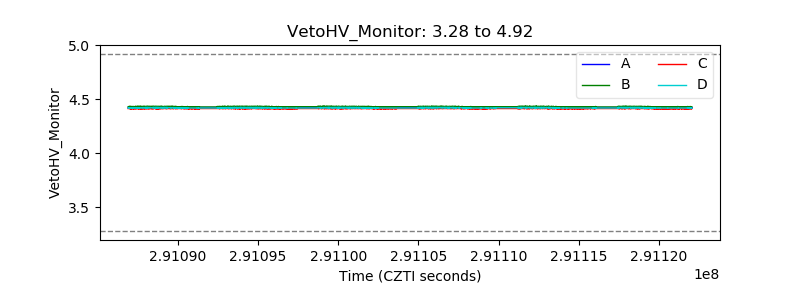 |
| Veto LLD |  |
| Alpha Counter |  |
| _CPM_Rate |  |
| CZT Counter |  |
| +2.5 Volts monitor |  |
| +5 Volts monitor |  |
| _ROLL_ROT |  |
| _Roll_DEC | 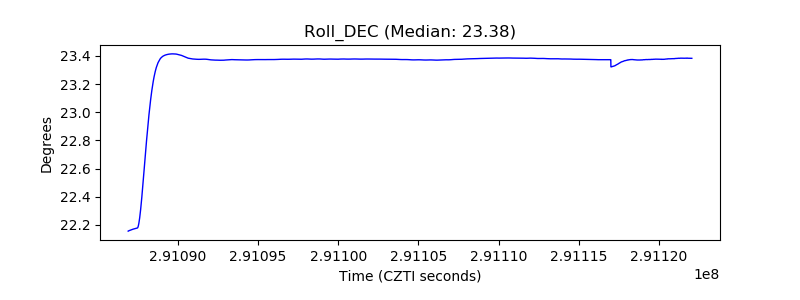 |
| _Roll_RA |  |
| Veto Counter |  |