| Param | Original file | Final file |
|---|---|---|
| Filename | modeM0/AS1A05_173T01_9000002812cztM0_level2_bc.evt | modeM0/AS1A05_173T01_9000002812cztM0_level2_quad_clean.evt |
| Size (bytes) | 6,151,904,640 | 2,192,448,960 |
| Size | 5.7 GB | 2.0 GB |
| Events in quadrant A | 37,875,560 | 14,049,953 |
| Events in quadrant B | 41,604,986 | 14,149,540 |
| Events in quadrant C | 40,970,253 | 13,556,516 |
| Events in quadrant D | 54,364,580 | 13,087,048 |
| Mode SS | |||
|---|---|---|---|
| Quadrant | BADHDUFLAG | Total packets | Discarded packets |
| A | 0 | 3444 | 0 |
| B | 0 | 3444 | 0 |
| C | 0 | 3444 | 0 |
| D | 0 | 3444 | 0 |
| Mode M9 | |||
|---|---|---|---|
| Quadrant | BADHDUFLAG | Total packets | Discarded packets |
| A | 0 | 246 | 0 |
| B | 0 | 246 | 0 |
| C | 0 | 246 | 0 |
| D | 0 | 246 | 0 |
| Mode M0 | |||
|---|---|---|---|
| Quadrant | BADHDUFLAG | Total packets | Discarded packets |
| A | 0 | 355269 | 0 |
| B | 0 | 373560 | 0 |
| C | 0 | 376081 | 0 |
| D | 0 | 419200 | 0 |
| Quadrant | Total seconds | Saturated seconds | Saturation percentage |
|---|---|---|---|
| A | 168821 | 1963 | 1.162770% |
| B | 168821 | 3114 | 1.844557% |
| C | 168821 | 4029 | 2.386551% |
| D | 168821 | 7228 | 4.281458% |
Noise dominated data is calculated using 1-second bins in cleaned event files. If a bin has >2000 counts, and if more than 50% of those come from <1% of pixels, then it is considered to be noise-dominated and hence unusable.
| Quadrant | # 1 sec bins | Bins with >0 counts | Bins with >2000 counts | High rate bins dominated by noise | Noise dominated (total time) | Noise dominated (detector-on time) | Marked lightcurve |
|---|---|---|---|---|---|---|---|
| A | 203133 | 168826 | 34 | 34 | 0.02% | 0.02% |  |
| B | 203133 | 168822 | 48 | 48 | 0.02% | 0.03% |  |
| C | 203133 | 168827 | 82 | 82 | 0.04% | 0.05% |  |
| D | 203133 | 168814 | 1325 | 1325 | 0.65% | 0.78% |  |
Top three noisy pixels from each quadrant. If the there are fewer than three noisy pixels in the level2.evt file, extra rows are filled as -1
| Pixel properties | Quadrant properties | ||||||
|---|---|---|---|---|---|---|---|
| Quadrant | DetID | PixID | Counts | Sigma | Mean | Median | Sigma |
| A | 8 | 144 | 1194305 | 585.6 | 9168 | 8983 | 2024.1 |
| A | 4 | 2 | 306455 | 146.96 | 9168 | 8983 | 2024.1 |
| A | 15 | 174 | 268427 | 128.18 | 9168 | 8983 | 2024.1 |
| B | 10 | 245 | 1012024 | 576.59 | 9178 | 8951 | 1739.7 |
| B | 7 | 220 | 978040 | 557.06 | 9178 | 8951 | 1739.7 |
| B | 0 | 229 | 818815 | 465.53 | 9178 | 8951 | 1739.7 |
| C | 3 | 233 | 5532711 | 2705.42 | 8730 | 8693 | 2041.8 |
| C | 0 | 207 | 1034257 | 502.28 | 8730 | 8693 | 2041.8 |
| C | 9 | 54 | 618056 | 298.44 | 8730 | 8693 | 2041.8 |
| D | 12 | 110 | 7225105 | 3538.07 | 8828 | 8521 | 2039.7 |
| D | 7 | 238 | 5061044 | 2477.1 | 8828 | 8521 | 2039.7 |
| D | 7 | 38 | 3209760 | 1569.47 | 8828 | 8521 | 2039.7 |
Histogram calculated using DETX and DETY for each event in the final _common_clean file
| Quadrant A |  |
 |
Quadrant B |
|---|---|---|---|
| Quadrant D |  |
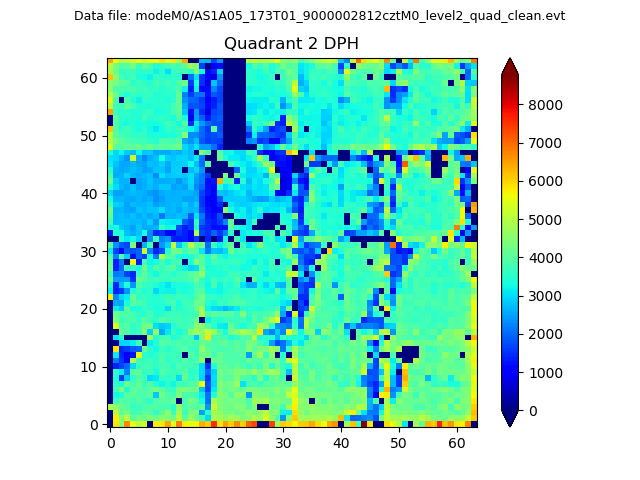 |
Quadrant C |
| Plot type | Count rate plots | Images |
|---|---|---|
| Comparison with Poisson distribution Blue bars denote a histogram of data divided into 1 sec bins. Red curve is a Poisson curve with rate = median count rate of data. |
 |
 |
| Quadrant-wise count rates Data is divided into 100 sec bins |
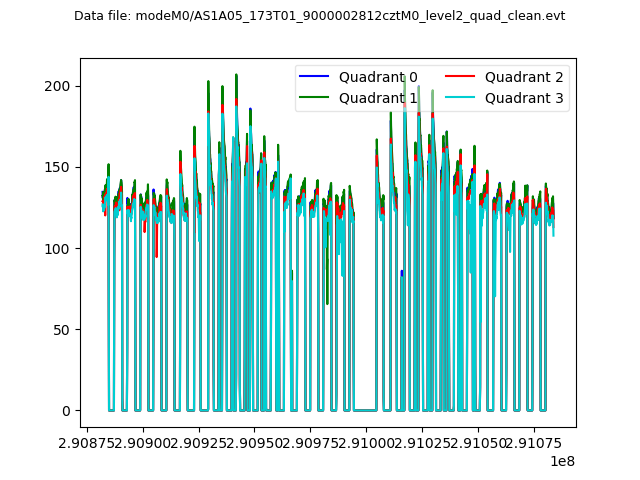 |
|
| Module-wise count rates for Quadrant A Data is divided into 100 sec bins |
 |
 |
| Module-wise count rates for Quadrant B Data is divided into 100 sec bins |
 |
 |
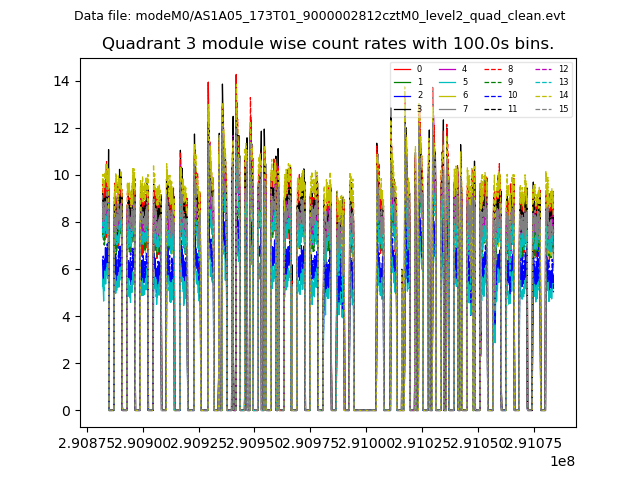
| Module-wise count rates for Quadrant C Data is divided into 100 sec bins |
 |
 |
| Module-wise count rates for Quadrant D Data is divided into 100 sec bins |
 |
 |
| Parameter | Plot |
|---|---|
| CZT HV Monitor |  |
| D_VDD |  |
| Temperature 1 |  |
| Veto HV Monitor | 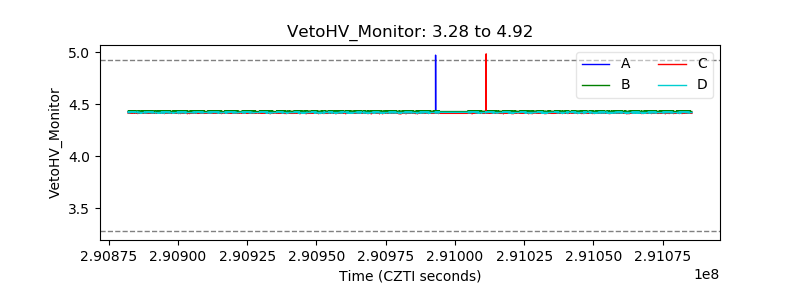 |
| Veto LLD | 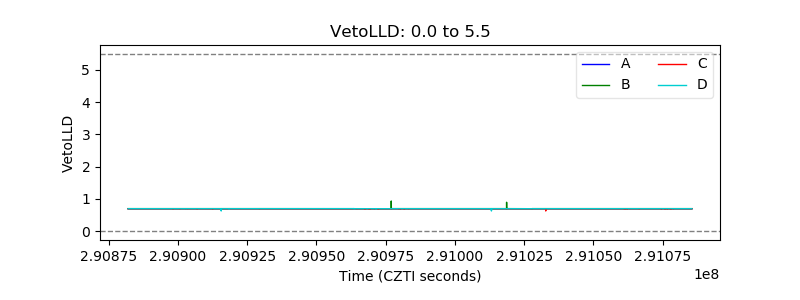 |
| Alpha Counter |  |
| _CPM_Rate |  |
| CZT Counter |  |
| +2.5 Volts monitor |  |
| +5 Volts monitor |  |
| _ROLL_ROT |  |
| _Roll_DEC |  |
| _Roll_RA |  |
| Veto Counter |  |