| Param | Original file | Final file |
|---|---|---|
| Filename | modeM0/AS1A05_088T03_9000002808cztM0_level2_bc.evt | modeM0/AS1A05_088T03_9000002808cztM0_level2_quad_clean.evt |
| Size (bytes) | 1,450,082,880 | 518,408,640 |
| Size | 1.4 GB | 494.4 MB |
| Events in quadrant A | 12,454,411 | 3,256,119 |
| Events in quadrant B | 9,474,395 | 3,331,649 |
| Events in quadrant C | 8,234,829 | 3,244,488 |
| Events in quadrant D | 11,097,810 | 3,198,381 |
| Mode M0 | |||
|---|---|---|---|
| Quadrant | BADHDUFLAG | Total packets | Discarded packets |
| A | 0 | 93764 | 0 |
| B | 0 | 86005 | 0 |
| C | 0 | 81668 | 0 |
| D | 0 | 89740 | 0 |
| Mode SS | |||
|---|---|---|---|
| Quadrant | BADHDUFLAG | Total packets | Discarded packets |
| A | 0 | 790 | 0 |
| B | 0 | 790 | 0 |
| C | 0 | 790 | 0 |
| D | 0 | 790 | 0 |
| Mode M9 | |||
|---|---|---|---|
| Quadrant | BADHDUFLAG | Total packets | Discarded packets |
| A | 0 | 79 | 0 |
| B | 0 | 79 | 0 |
| C | 0 | 79 | 0 |
| D | 0 | 79 | 0 |
| Quadrant | Total seconds | Saturated seconds | Saturation percentage |
|---|---|---|---|
| A | 38918 | 1347 | 3.461123% |
| B | 38918 | 784 | 2.014492% |
| C | 38918 | 767 | 1.970810% |
| D | 38918 | 791 | 2.032479% |
Noise dominated data is calculated using 1-second bins in cleaned event files. If a bin has >2000 counts, and if more than 50% of those come from <1% of pixels, then it is considered to be noise-dominated and hence unusable.
| Quadrant | # 1 sec bins | Bins with >0 counts | Bins with >2000 counts | High rate bins dominated by noise | Noise dominated (total time) | Noise dominated (detector-on time) | Marked lightcurve |
|---|---|---|---|---|---|---|---|
| A | 46568 | 38922 | 504 | 504 | 1.08% | 1.29% |  |
| B | 46568 | 38920 | 4 | 4 | 0.01% | 0.01% |  |
| C | 46568 | 38919 | 2 | 2 | 0.00% | 0.01% |  |
| D | 46568 | 38919 | 60 | 60 | 0.13% | 0.15% | 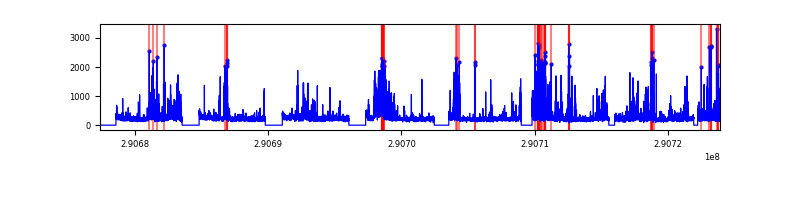 |
Top three noisy pixels from each quadrant. If the there are fewer than three noisy pixels in the level2.evt file, extra rows are filled as -1
| Pixel properties | Quadrant properties | ||||||
|---|---|---|---|---|---|---|---|
| Quadrant | DetID | PixID | Counts | Sigma | Mean | Median | Sigma |
| A | 6 | 16 | 3879997 | 8189.97 | 2184 | 2147 | 473.5 |
| A | 13 | 254 | 59963 | 122.11 | 2184 | 2147 | 473.5 |
| A | 15 | 192 | 55391 | 112.45 | 2184 | 2147 | 473.5 |
| B | 7 | 220 | 465893 | 1135.66 | 2198 | 2153 | 408.3 |
| B | 0 | 229 | 160165 | 386.96 | 2198 | 2153 | 408.3 |
| B | 0 | 197 | 156880 | 378.91 | 2198 | 2153 | 408.3 |
| C | 0 | 207 | 53694 | 105.76 | 2109 | 2106 | 487.8 |
| C | 3 | 233 | 52843 | 104.02 | 2109 | 2106 | 487.8 |
| C | 6 | 96 | 17411 | 31.38 | 2109 | 2106 | 487.8 |
| D | 1 | 52 | 1197454 | 2436.53 | 2169 | 2104 | 490.6 |
| D | 14 | 34 | 1017289 | 2069.29 | 2169 | 2104 | 490.6 |
| D | 2 | 234 | 197675 | 398.64 | 2169 | 2104 | 490.6 |
Histogram calculated using DETX and DETY for each event in the final _common_clean file
| Quadrant A | 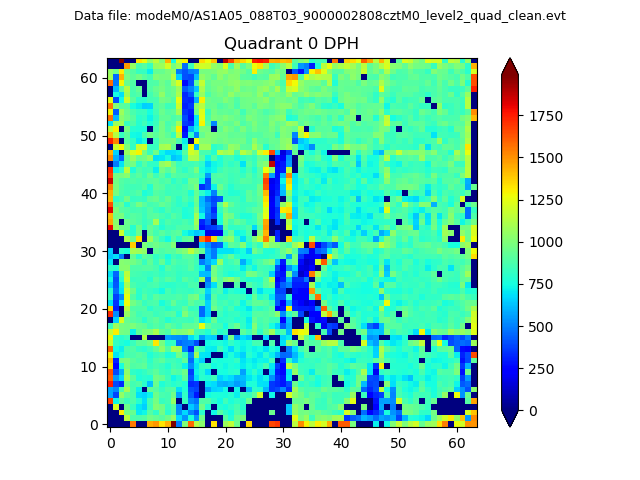 |
 |
Quadrant B |
|---|---|---|---|
| Quadrant D | 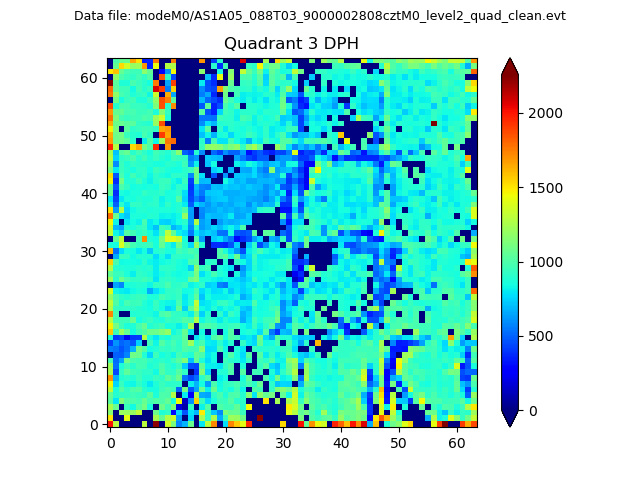 |
 |
Quadrant C |
| Plot type | Count rate plots | Images |
|---|---|---|
| Comparison with Poisson distribution Blue bars denote a histogram of data divided into 1 sec bins. Red curve is a Poisson curve with rate = median count rate of data. |
 |
 |
| Quadrant-wise count rates Data is divided into 100 sec bins |
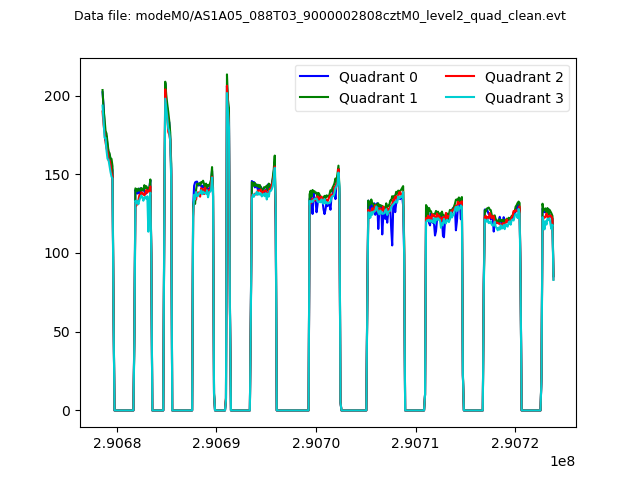 |
|
| Module-wise count rates for Quadrant A Data is divided into 100 sec bins |
 |
 |
| Module-wise count rates for Quadrant B Data is divided into 100 sec bins |
 |
 |
| Module-wise count rates for Quadrant C Data is divided into 100 sec bins |
 |
 |
| Module-wise count rates for Quadrant D Data is divided into 100 sec bins |
 |
 |
| Parameter | Plot |
|---|---|
| CZT HV Monitor |  |
| D_VDD |  |
| Temperature 1 | 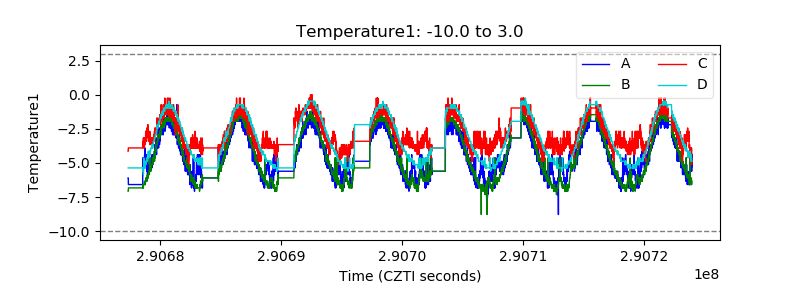 |
| Veto HV Monitor |  |
| Veto LLD |  |
| Alpha Counter |  |
| _CPM_Rate |  |
| CZT Counter | 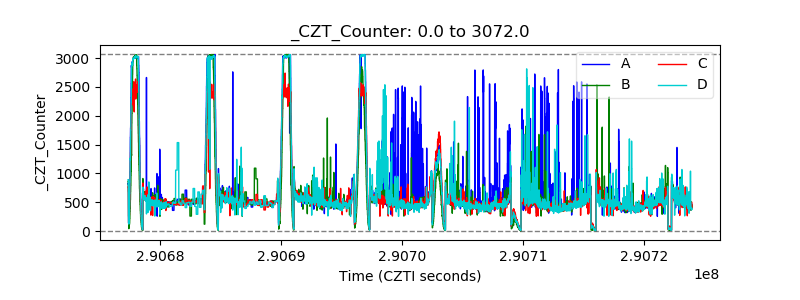 |
| +2.5 Volts monitor |  |
| +5 Volts monitor |  |
| _ROLL_ROT |  |
| _Roll_DEC |  |
| _Roll_RA |  |
| Veto Counter |  |