| Param | Original file | Final file |
|---|---|---|
| Filename | modeM0/AS1A05_024T01_9000002810cztM0_level2_bc.evt | modeM0/AS1A05_024T01_9000002810cztM0_level2_quad_clean.evt |
| Size (bytes) | 4,654,906,560 | 1,721,943,360 |
| Size | 4.3 GB | 1.6 GB |
| Events in quadrant A | 30,389,840 | 10,919,299 |
| Events in quadrant B | 30,558,015 | 11,111,472 |
| Events in quadrant C | 30,038,363 | 10,640,350 |
| Events in quadrant D | 40,902,507 | 10,345,988 |
| Mode SS | |||
|---|---|---|---|
| Quadrant | BADHDUFLAG | Total packets | Discarded packets |
| A | 0 | 2714 | 0 |
| B | 0 | 2714 | 0 |
| C | 0 | 2714 | 0 |
| D | 0 | 2714 | 0 |
| Mode M9 | |||
|---|---|---|---|
| Quadrant | BADHDUFLAG | Total packets | Discarded packets |
| A | 0 | 230 | 0 |
| B | 0 | 230 | 0 |
| C | 0 | 230 | 0 |
| D | 0 | 230 | 0 |
| Mode M0 | |||
|---|---|---|---|
| Quadrant | BADHDUFLAG | Total packets | Discarded packets |
| A | 0 | 283572 | 0 |
| B | 0 | 285789 | 0 |
| C | 0 | 288359 | 0 |
| D | 0 | 321208 | 0 |
| Quadrant | Total seconds | Saturated seconds | Saturation percentage |
|---|---|---|---|
| A | 133418 | 1791 | 1.342398% |
| B | 133418 | 1952 | 1.463071% |
| C | 133418 | 2433 | 1.823592% |
| D | 133418 | 3923 | 2.940383% |
Noise dominated data is calculated using 1-second bins in cleaned event files. If a bin has >2000 counts, and if more than 50% of those come from <1% of pixels, then it is considered to be noise-dominated and hence unusable.
| Quadrant | # 1 sec bins | Bins with >0 counts | Bins with >2000 counts | High rate bins dominated by noise | Noise dominated (total time) | Noise dominated (detector-on time) | Marked lightcurve |
|---|---|---|---|---|---|---|---|
| A | 156183 | 133423 | 158 | 158 | 0.10% | 0.12% |  |
| B | 156183 | 133421 | 16 | 16 | 0.01% | 0.01% | 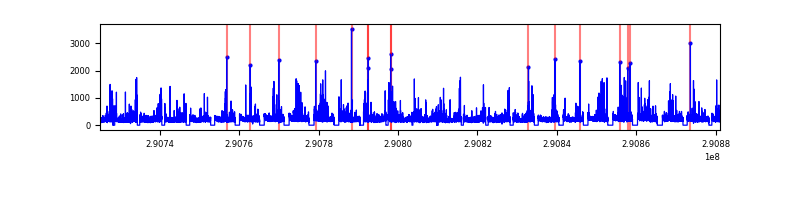 |
| C | 156183 | 133418 | 54 | 54 | 0.03% | 0.04% |  |
| D | 156183 | 133419 | 498 | 498 | 0.32% | 0.37% |  |
Top three noisy pixels from each quadrant. If the there are fewer than three noisy pixels in the level2.evt file, extra rows are filled as -1
| Pixel properties | Quadrant properties | ||||||
|---|---|---|---|---|---|---|---|
| Quadrant | DetID | PixID | Counts | Sigma | Mean | Median | Sigma |
| A | 6 | 16 | 1480188 | 947.18 | 7238 | 7114 | 1555.2 |
| A | 0 | 254 | 486655 | 308.34 | 7238 | 7114 | 1555.2 |
| A | 13 | 254 | 201773 | 125.16 | 7238 | 7114 | 1555.2 |
| B | 7 | 220 | 635824 | 465.58 | 7302 | 7128 | 1350.4 |
| B | 6 | 36 | 395550 | 287.64 | 7302 | 7128 | 1350.4 |
| B | 0 | 197 | 298690 | 215.92 | 7302 | 7128 | 1350.4 |
| C | 3 | 233 | 2254381 | 1371.28 | 7020 | 6997 | 1638.9 |
| C | 9 | 54 | 635886 | 383.73 | 7020 | 6997 | 1638.9 |
| C | 6 | 96 | 71363 | 39.27 | 7020 | 6997 | 1638.9 |
| D | 1 | 52 | 6223215 | 3788.93 | 7112 | 6883 | 1640.7 |
| D | 5 | 222 | 5008082 | 3048.29 | 7112 | 6883 | 1640.7 |
| D | 12 | 110 | 621120 | 374.38 | 7112 | 6883 | 1640.7 |
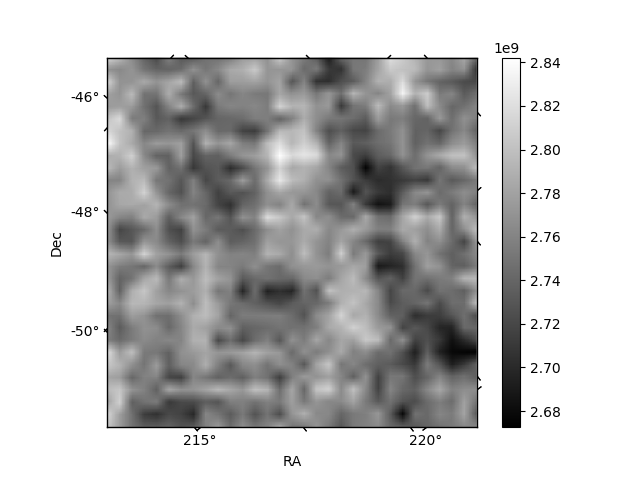
Histogram calculated using DETX and DETY for each event in the final _common_clean file
| Quadrant A | 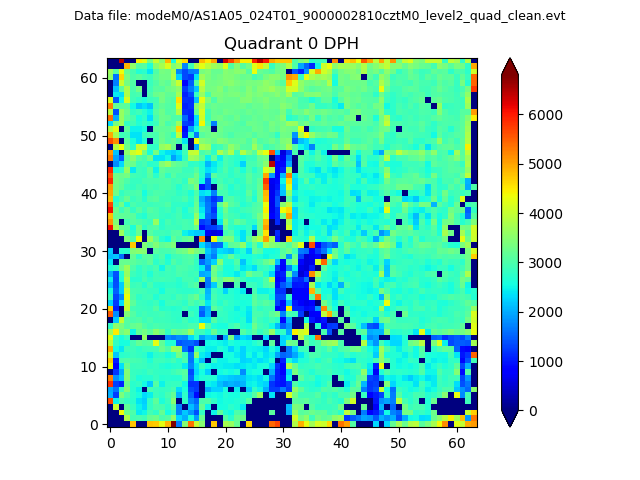 |
 |
Quadrant B |
|---|---|---|---|
| Quadrant D | 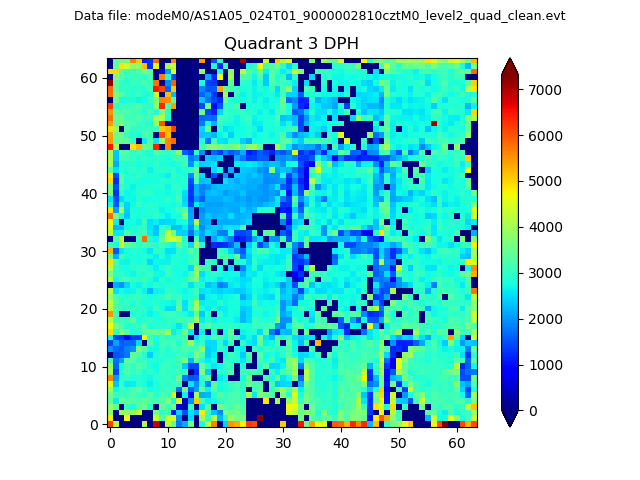 |
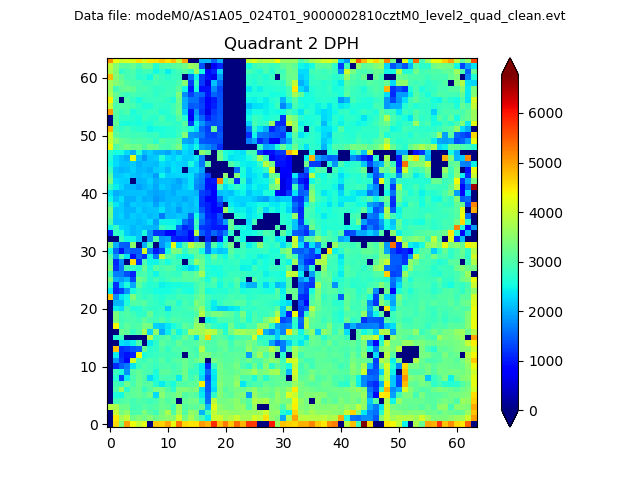 |
Quadrant C |
| Plot type | Count rate plots | Images |
|---|---|---|
| Comparison with Poisson distribution Blue bars denote a histogram of data divided into 1 sec bins. Red curve is a Poisson curve with rate = median count rate of data. |
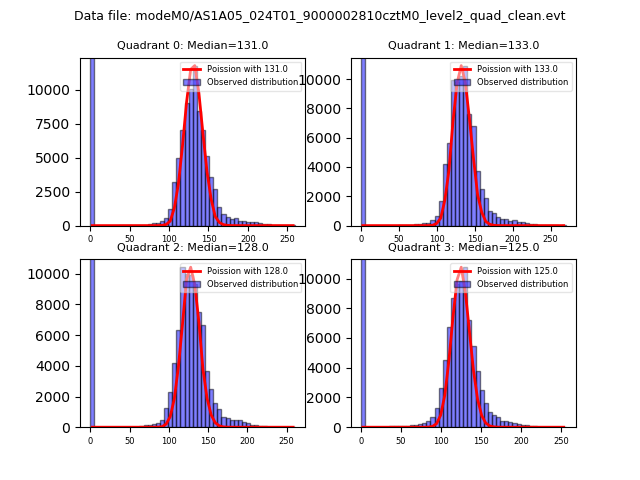 |
 |
| Quadrant-wise count rates Data is divided into 100 sec bins |
 |
|
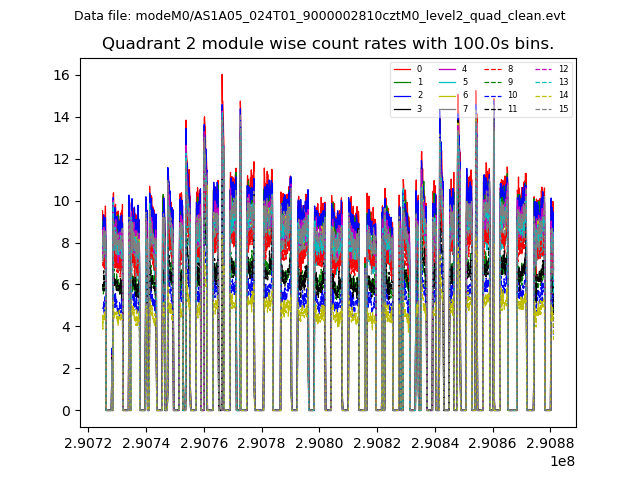
| Module-wise count rates for Quadrant A Data is divided into 100 sec bins |
 |
 |
| Module-wise count rates for Quadrant B Data is divided into 100 sec bins |
 |
 |
| Module-wise count rates for Quadrant C Data is divided into 100 sec bins |
 |
 |
| Module-wise count rates for Quadrant D Data is divided into 100 sec bins |
 |
 |
| Parameter | Plot |
|---|---|
| CZT HV Monitor |  |
| D_VDD |  |
| Temperature 1 | 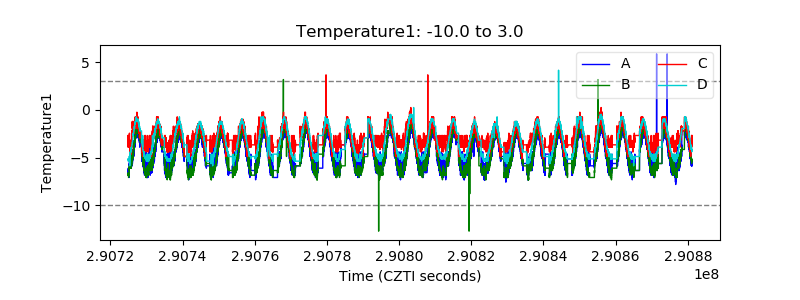 |
| Veto HV Monitor |  |
| Veto LLD |  |
| Alpha Counter |  |
| _CPM_Rate |  |
| CZT Counter |  |
| +2.5 Volts monitor |  |
| +5 Volts monitor |  |
| _ROLL_ROT |  |
| _Roll_DEC |  |
| _Roll_RA | 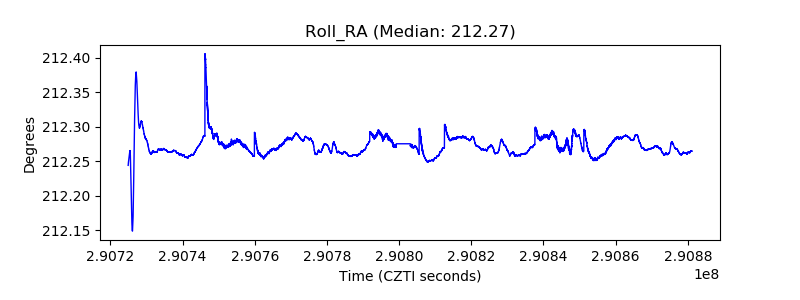 |
| Veto Counter |  |