| Param | Original file | Final file |
|---|---|---|
| Filename | modeM0/AS1A05_115T03_9000002806cztM0_level2_bc.evt | modeM0/AS1A05_115T03_9000002806cztM0_level2_quad_clean.evt |
| Size (bytes) | 1,960,606,080 | 781,706,880 |
| Size | 1.8 GB | 745.5 MB |
| Events in quadrant A | 14,053,361 | 4,923,613 |
| Events in quadrant B | 12,702,743 | 5,006,382 |
| Events in quadrant C | 12,772,746 | 4,835,733 |
| Events in quadrant D | 15,710,412 | 4,751,415 |
| Mode SS | |||
|---|---|---|---|
| Quadrant | BADHDUFLAG | Total packets | Discarded packets |
| A | 0 | 1234 | 0 |
| B | 0 | 1234 | 0 |
| C | 0 | 1234 | 0 |
| D | 0 | 1234 | 0 |
| Mode M0 | |||
|---|---|---|---|
| Quadrant | BADHDUFLAG | Total packets | Discarded packets |
| A | 0 | 130731 | 0 |
| B | 0 | 126756 | 0 |
| C | 0 | 128164 | 0 |
| D | 0 | 135280 | 0 |
| Mode M9 | |||
|---|---|---|---|
| Quadrant | BADHDUFLAG | Total packets | Discarded packets |
| A | 0 | 86 | 0 |
| B | 0 | 86 | 0 |
| C | 0 | 86 | 0 |
| D | 0 | 86 | 0 |
| Quadrant | Total seconds | Saturated seconds | Saturation percentage |
|---|---|---|---|
| A | 60658 | 920 | 1.516700% |
| B | 60658 | 879 | 1.449108% |
| C | 60658 | 1045 | 1.722774% |
| D | 60658 | 1072 | 1.767285% |
Noise dominated data is calculated using 1-second bins in cleaned event files. If a bin has >2000 counts, and if more than 50% of those come from <1% of pixels, then it is considered to be noise-dominated and hence unusable.
| Quadrant | # 1 sec bins | Bins with >0 counts | Bins with >2000 counts | High rate bins dominated by noise | Noise dominated (total time) | Noise dominated (detector-on time) | Marked lightcurve |
|---|---|---|---|---|---|---|---|
| A | 69208 | 60660 | 166 | 166 | 0.24% | 0.27% |  |
| B | 69208 | 60659 | 0 | 0 | 0.00% | 0.00% |  |
| C | 69208 | 60658 | 1 | 1 | 0.00% | 0.00% | 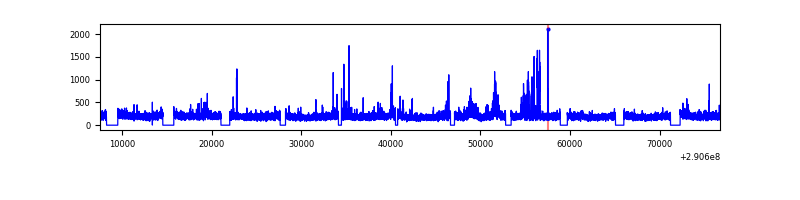 |
| D | 69208 | 60658 | 98 | 98 | 0.14% | 0.16% |  |
Top three noisy pixels from each quadrant. If the there are fewer than three noisy pixels in the level2.evt file, extra rows are filled as -1
| Pixel properties | Quadrant properties | ||||||
|---|---|---|---|---|---|---|---|
| Quadrant | DetID | PixID | Counts | Sigma | Mean | Median | Sigma |
| A | 15 | 192 | 1005296 | 1466.73 | 3162 | 3100 | 683.3 |
| A | 6 | 16 | 710458 | 1035.23 | 3162 | 3100 | 683.3 |
| A | 13 | 254 | 81497 | 114.73 | 3162 | 3100 | 683.3 |
| B | 0 | 229 | 169560 | 277.16 | 3193 | 3109 | 600.6 |
| B | 10 | 245 | 157134 | 256.47 | 3193 | 3109 | 600.6 |
| B | 4 | 216 | 40859 | 62.86 | 3193 | 3109 | 600.6 |
| C | 3 | 233 | 847394 | 1178.16 | 3071 | 3056 | 716.7 |
| C | 6 | 96 | 53171 | 69.93 | 3071 | 3056 | 716.7 |
| C | 8 | 128 | 26195 | 32.29 | 3071 | 3056 | 716.7 |
| D | 7 | 238 | 1454242 | 2013.92 | 3137 | 3026 | 720.6 |
| D | 1 | 52 | 838621 | 1159.59 | 3137 | 3026 | 720.6 |
| D | 7 | 223 | 655831 | 905.93 | 3137 | 3026 | 720.6 |
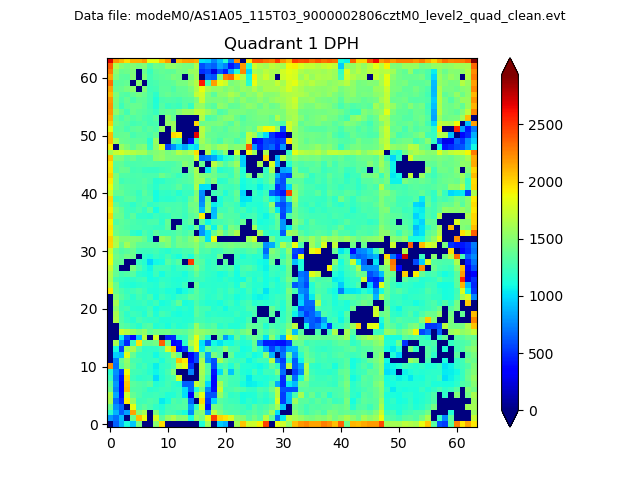
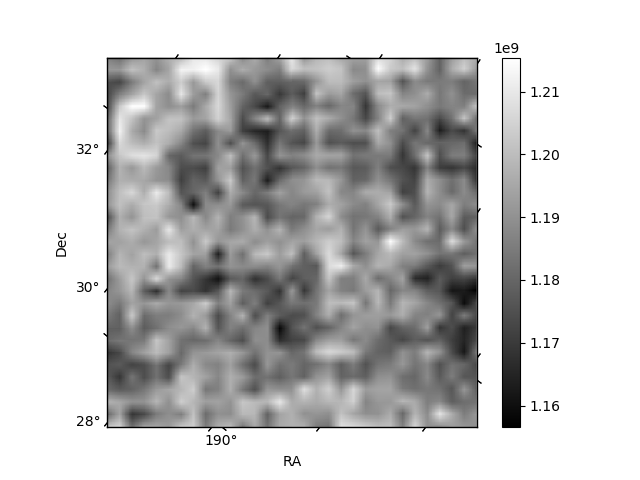
Histogram calculated using DETX and DETY for each event in the final _common_clean file
| Quadrant A |  |
 |
Quadrant B |
|---|---|---|---|
| Quadrant D | 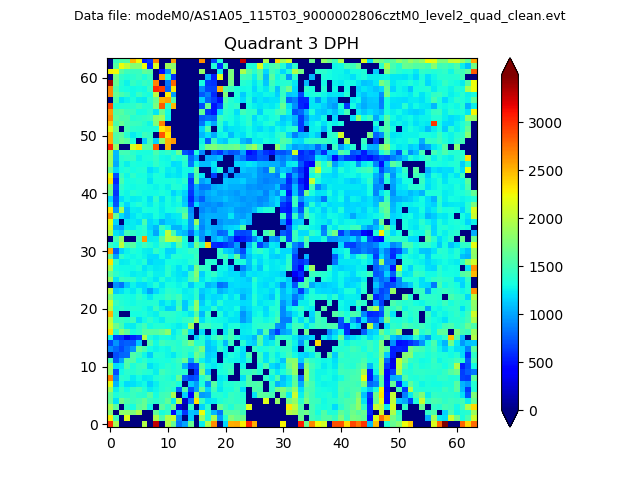 |
 |
Quadrant C |
| Plot type | Count rate plots | Images |
|---|---|---|
| Comparison with Poisson distribution Blue bars denote a histogram of data divided into 1 sec bins. Red curve is a Poisson curve with rate = median count rate of data. |
 |
 |
| Quadrant-wise count rates Data is divided into 100 sec bins |
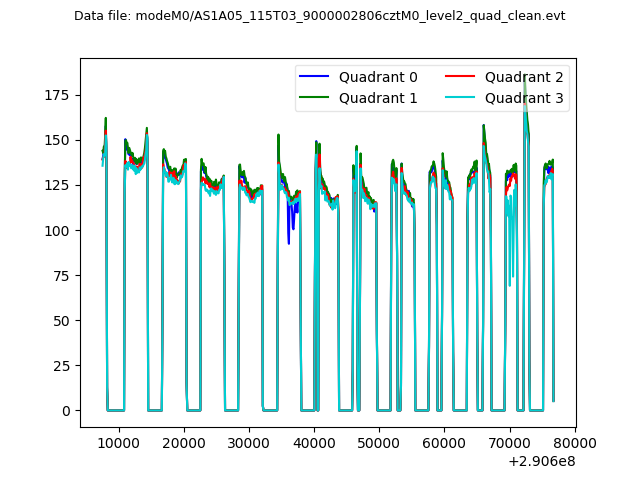 |
|
| Module-wise count rates for Quadrant A Data is divided into 100 sec bins |
 |
 |
| Module-wise count rates for Quadrant B Data is divided into 100 sec bins |
 |
 |
| Module-wise count rates for Quadrant C Data is divided into 100 sec bins |
 |
 |
| Module-wise count rates for Quadrant D Data is divided into 100 sec bins |
 |
 |
| Parameter | Plot |
|---|---|
| CZT HV Monitor |  |
| D_VDD | 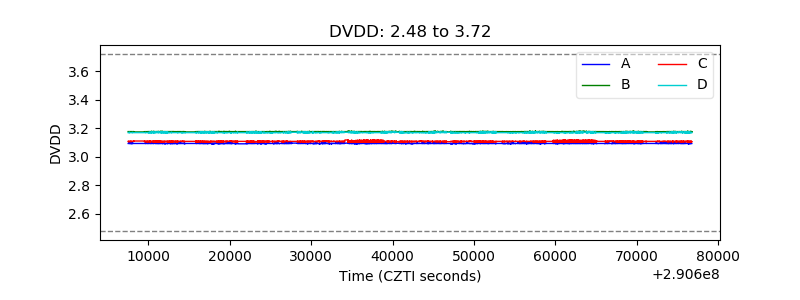 |
| Temperature 1 |  |
| Veto HV Monitor |  |
| Veto LLD |  |
| Alpha Counter |  |
| _CPM_Rate |  |
| CZT Counter |  |
| +2.5 Volts monitor |  |
| +5 Volts monitor |  |
| _ROLL_ROT |  |
| _Roll_DEC | 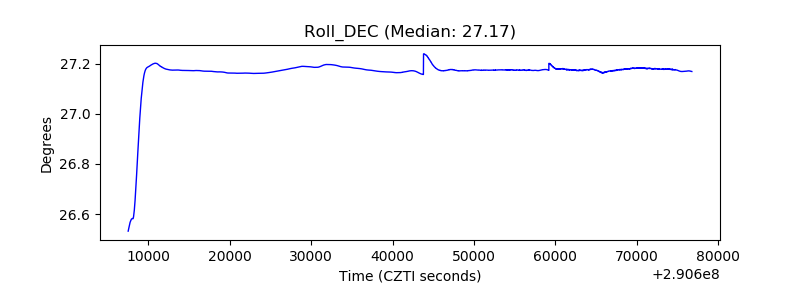 |
| _Roll_RA | 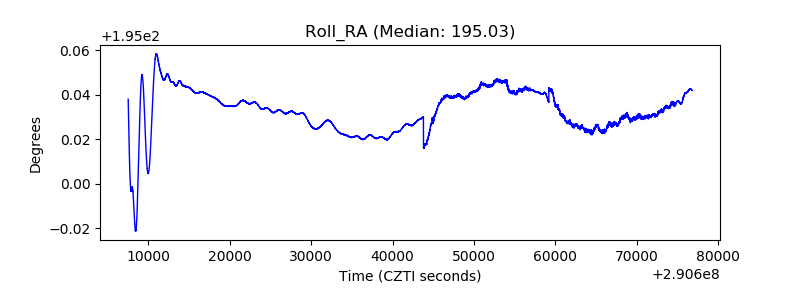 |
| Veto Counter |  |