| Param | Original file | Final file |
|---|---|---|
| Filename | modeM0/AS1A05_156T01_9000002804cztM0_level2_bc.evt | modeM0/AS1A05_156T01_9000002804cztM0_level2_quad_clean.evt |
| Size (bytes) | 2,349,083,520 | 922,792,320 |
| Size | 2.2 GB | 880.0 MB |
| Events in quadrant A | 15,335,430 | 5,824,342 |
| Events in quadrant B | 16,209,860 | 5,880,651 |
| Events in quadrant C | 15,835,431 | 5,697,893 |
| Events in quadrant D | 18,875,736 | 5,634,829 |
| Mode M0 | |||
|---|---|---|---|
| Quadrant | BADHDUFLAG | Total packets | Discarded packets |
| A | 0 | 150247 | 0 |
| B | 0 | 153627 | 0 |
| C | 0 | 153768 | 0 |
| D | 0 | 160417 | 0 |
| Mode M9 | |||
|---|---|---|---|
| Quadrant | BADHDUFLAG | Total packets | Discarded packets |
| A | 0 | 118 | 0 |
| B | 0 | 119 | 0 |
| C | 0 | 119 | 0 |
| D | 0 | 119 | 0 |
| Mode SS | |||
|---|---|---|---|
| Quadrant | BADHDUFLAG | Total packets | Discarded packets |
| A | 0 | 1458 | 0 |
| B | 0 | 1458 | 0 |
| C | 0 | 1458 | 0 |
| D | 0 | 1458 | 0 |
| Quadrant | Total seconds | Saturated seconds | Saturation percentage |
|---|---|---|---|
| A | 71662 | 690 | 0.962853% |
| B | 71662 | 1075 | 1.500098% |
| C | 71661 | 1291 | 1.801538% |
| D | 71661 | 1050 | 1.465232% |
Noise dominated data is calculated using 1-second bins in cleaned event files. If a bin has >2000 counts, and if more than 50% of those come from <1% of pixels, then it is considered to be noise-dominated and hence unusable.
| Quadrant | # 1 sec bins | Bins with >0 counts | Bins with >2000 counts | High rate bins dominated by noise | Noise dominated (total time) | Noise dominated (detector-on time) | Marked lightcurve |
|---|---|---|---|---|---|---|---|
| A | 87467 | 71664 | 1 | 1 | 0.00% | 0.00% |  |
| B | 87467 | 71662 | 16 | 16 | 0.02% | 0.02% |  |
| C | 87467 | 71662 | 13 | 13 | 0.01% | 0.02% |  |
| D | 87467 | 71661 | 94 | 94 | 0.11% | 0.13% | 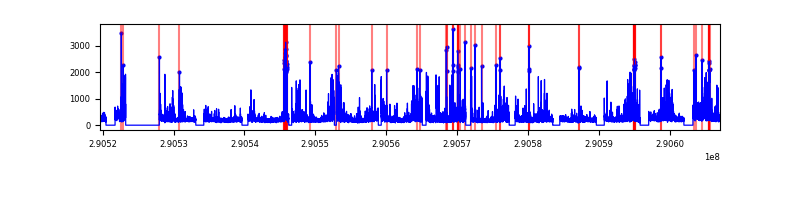 |
Top three noisy pixels from each quadrant. If the there are fewer than three noisy pixels in the level2.evt file, extra rows are filled as -1
| Pixel properties | Quadrant properties | ||||||
|---|---|---|---|---|---|---|---|
| Quadrant | DetID | PixID | Counts | Sigma | Mean | Median | Sigma |
| A | 15 | 192 | 300781 | 360.18 | 3825 | 3754 | 824.7 |
| A | 15 | 191 | 133231 | 157.01 | 3825 | 3754 | 824.7 |
| A | 13 | 254 | 105594 | 123.49 | 3825 | 3754 | 824.7 |
| B | 10 | 245 | 568647 | 790.7 | 3844 | 3755 | 714.4 |
| B | 15 | 201 | 151158 | 206.32 | 3844 | 3755 | 714.4 |
| B | 0 | 197 | 124997 | 169.71 | 3844 | 3755 | 714.4 |
| C | 3 | 233 | 1186434 | 1380.3 | 3687 | 3671 | 856.9 |
| C | 9 | 54 | 276445 | 318.33 | 3687 | 3671 | 856.9 |
| C | 0 | 239 | 94994 | 106.58 | 3687 | 3671 | 856.9 |
| D | 13 | 168 | 1473708 | 1714.24 | 3780 | 3655 | 857.6 |
| D | 1 | 52 | 1355756 | 1576.7 | 3780 | 3655 | 857.6 |
| D | 14 | 34 | 589767 | 683.47 | 3780 | 3655 | 857.6 |
Histogram calculated using DETX and DETY for each event in the final _common_clean file
| Quadrant A |  |
 |
Quadrant B |
|---|---|---|---|
| Quadrant D |  |
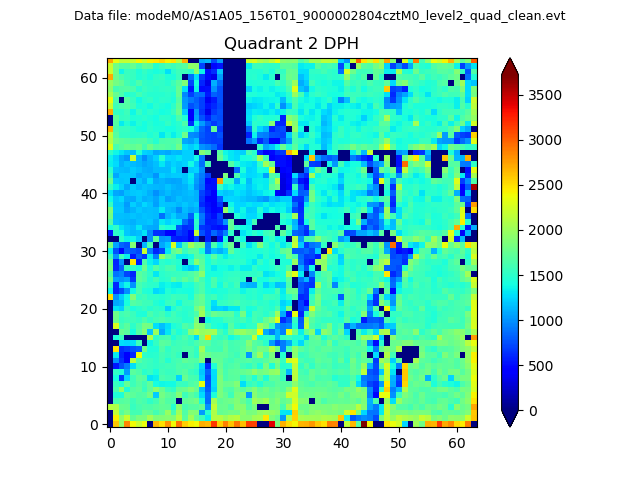 |
Quadrant C |
| Plot type | Count rate plots | Images |
|---|---|---|
| Comparison with Poisson distribution Blue bars denote a histogram of data divided into 1 sec bins. Red curve is a Poisson curve with rate = median count rate of data. |
 |
 |
| Quadrant-wise count rates Data is divided into 100 sec bins |
 |
|
| Module-wise count rates for Quadrant A Data is divided into 100 sec bins |
 |
 |
| Module-wise count rates for Quadrant B Data is divided into 100 sec bins |
 |
 |
| Module-wise count rates for Quadrant C Data is divided into 100 sec bins |
 |
 |
| Module-wise count rates for Quadrant D Data is divided into 100 sec bins |
 |
 |
| Parameter | Plot |
|---|---|
| CZT HV Monitor |  |
| D_VDD |  |
| Temperature 1 | 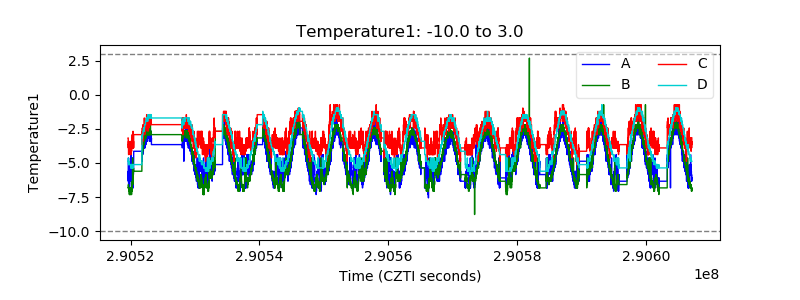 |
| Veto HV Monitor |  |
| Veto LLD |  |
| Alpha Counter |  |
| _CPM_Rate | 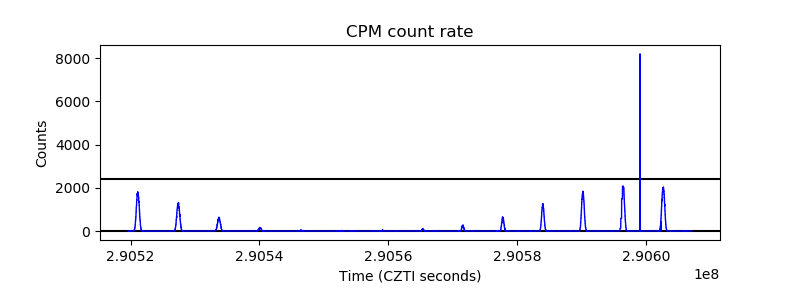 |
| CZT Counter |  |
| +2.5 Volts monitor |  |
| +5 Volts monitor |  |
| _ROLL_ROT |  |
| _Roll_DEC |  |
| _Roll_RA |  |
| Veto Counter |  |