| Param | Original file | Final file |
|---|---|---|
| Filename | modeM0/AS1A05_072T04_9000002802cztM0_level2_bc.evt | modeM0/AS1A05_072T04_9000002802cztM0_level2_quad_clean.evt |
| Size (bytes) | 2,624,656,320 | 969,304,320 |
| Size | 2.4 GB | 924.4 MB |
| Events in quadrant A | 17,646,299 | 6,115,171 |
| Events in quadrant B | 22,728,615 | 6,160,222 |
| Events in quadrant C | 15,672,682 | 6,042,325 |
| Events in quadrant D | 18,352,505 | 5,923,693 |
| Mode SS | |||
|---|---|---|---|
| Quadrant | BADHDUFLAG | Total packets | Discarded packets |
| A | 0 | 1526 | 0 |
| B | 0 | 1526 | 0 |
| C | 0 | 1526 | 0 |
| D | 0 | 1526 | 0 |
| Mode M9 | |||
|---|---|---|---|
| Quadrant | BADHDUFLAG | Total packets | Discarded packets |
| A | 0 | 121 | 0 |
| B | 0 | 121 | 0 |
| C | 0 | 121 | 0 |
| D | 0 | 121 | 0 |
| Mode M0 | |||
|---|---|---|---|
| Quadrant | BADHDUFLAG | Total packets | Discarded packets |
| A | 0 | 161176 | 0 |
| B | 0 | 181293 | 0 |
| C | 0 | 156549 | 0 |
| D | 0 | 164463 | 0 |
| Quadrant | Total seconds | Saturated seconds | Saturation percentage |
|---|---|---|---|
| A | 74633 | 859 | 1.150965% |
| B | 74633 | 2375 | 3.182238% |
| C | 74633 | 1111 | 1.488618% |
| D | 74633 | 1427 | 1.912023% |
Noise dominated data is calculated using 1-second bins in cleaned event files. If a bin has >2000 counts, and if more than 50% of those come from <1% of pixels, then it is considered to be noise-dominated and hence unusable.
| Quadrant | # 1 sec bins | Bins with >0 counts | Bins with >2000 counts | High rate bins dominated by noise | Noise dominated (total time) | Noise dominated (detector-on time) | Marked lightcurve |
|---|---|---|---|---|---|---|---|
| A | 86949 | 74638 | 4 | 4 | 0.00% | 0.01% | 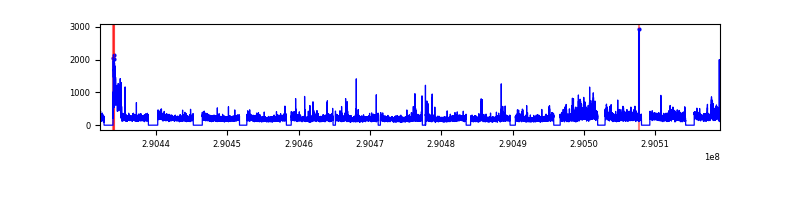 |
| B | 86949 | 74635 | 162 | 162 | 0.19% | 0.22% |  |
| C | 86949 | 74635 | 1 | 1 | 0.00% | 0.00% |  |
| D | 86949 | 74633 | 104 | 104 | 0.12% | 0.14% |  |
Top three noisy pixels from each quadrant. If the there are fewer than three noisy pixels in the level2.evt file, extra rows are filled as -1
| Pixel properties | Quadrant properties | ||||||
|---|---|---|---|---|---|---|---|
| Quadrant | DetID | PixID | Counts | Sigma | Mean | Median | Sigma |
| A | 15 | 192 | 1078547 | 1237.85 | 4018 | 3949 | 868.1 |
| A | 14 | 4 | 779080 | 892.89 | 4018 | 3949 | 868.1 |
| A | 15 | 191 | 125192 | 139.66 | 4018 | 3949 | 868.1 |
| B | 10 | 245 | 5568472 | 7449.81 | 4019 | 3928 | 746.9 |
| B | 7 | 220 | 555135 | 737.96 | 4019 | 3928 | 746.9 |
| B | 4 | 216 | 273790 | 361.29 | 4019 | 3928 | 746.9 |
| C | 3 | 233 | 599632 | 657.76 | 3883 | 3866 | 905.7 |
| C | 0 | 207 | 58999 | 60.87 | 3883 | 3866 | 905.7 |
| C | 0 | 239 | 34493 | 33.81 | 3883 | 3866 | 905.7 |
| D | 14 | 34 | 1318501 | 1453.2 | 3964 | 3829 | 904.7 |
| D | 13 | 168 | 575348 | 631.74 | 3964 | 3829 | 904.7 |
| D | 7 | 238 | 474680 | 520.47 | 3964 | 3829 | 904.7 |
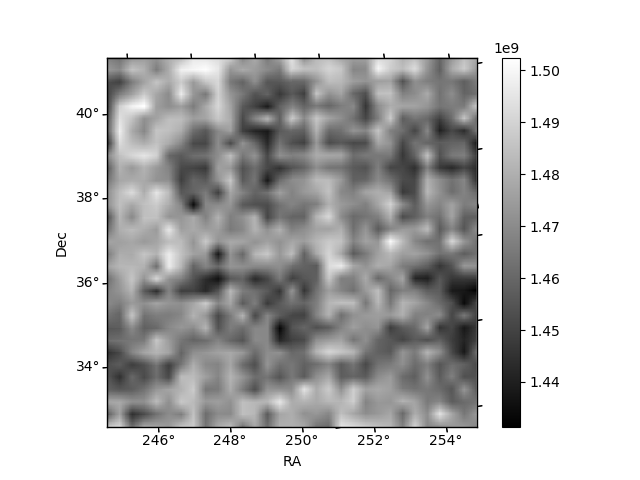
Histogram calculated using DETX and DETY for each event in the final _common_clean file
| Quadrant A |  |
 |
Quadrant B |
|---|---|---|---|
| Quadrant D |  |
 |
Quadrant C |
| Plot type | Count rate plots | Images |
|---|---|---|
| Comparison with Poisson distribution Blue bars denote a histogram of data divided into 1 sec bins. Red curve is a Poisson curve with rate = median count rate of data. |
 |
 |
| Quadrant-wise count rates Data is divided into 100 sec bins |
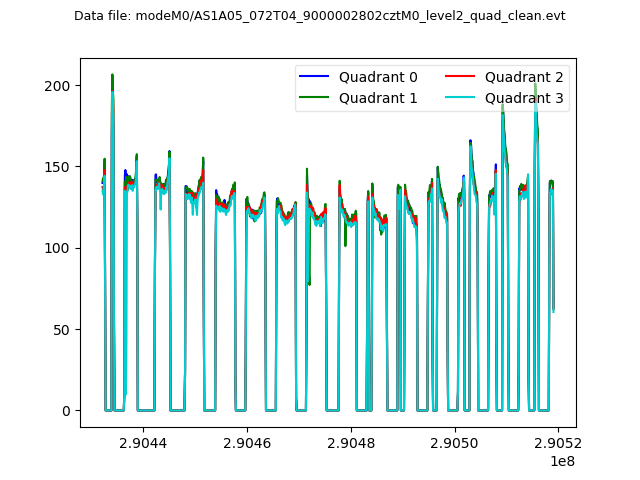 |
|
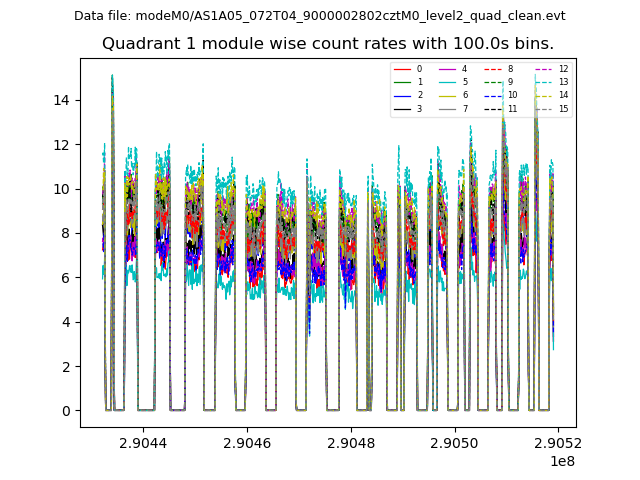
| Module-wise count rates for Quadrant A Data is divided into 100 sec bins |
 |
 |
| Module-wise count rates for Quadrant B Data is divided into 100 sec bins |
 |
 |
| Module-wise count rates for Quadrant C Data is divided into 100 sec bins |
 |
 |
| Module-wise count rates for Quadrant D Data is divided into 100 sec bins |
 |
 |
| Parameter | Plot |
|---|---|
| CZT HV Monitor |  |
| D_VDD |  |
| Temperature 1 |  |
| Veto HV Monitor |  |
| Veto LLD |  |
| Alpha Counter |  |
| _CPM_Rate |  |
| CZT Counter |  |
| +2.5 Volts monitor |  |
| +5 Volts monitor |  |
| _ROLL_ROT |  |
| _Roll_DEC |  |
| _Roll_RA |  |
| Veto Counter |  |