| Param | Original file | Final file |
|---|---|---|
| Filename | modeM0/AS1T03_091T01_9000002798cztM0_level2_bc.evt | modeM0/AS1T03_091T01_9000002798cztM0_level2_quad_clean.evt |
| Size (bytes) | 1,424,707,200 | 541,134,720 |
| Size | 1.3 GB | 516.1 MB |
| Events in quadrant A | 8,274,541 | 3,501,682 |
| Events in quadrant B | 13,492,231 | 3,460,372 |
| Events in quadrant C | 9,009,763 | 3,355,369 |
| Events in quadrant D | 9,619,871 | 3,306,033 |
| Mode M0 | |||
|---|---|---|---|
| Quadrant | BADHDUFLAG | Total packets | Discarded packets |
| A | 0 | 83289 | 0 |
| B | 0 | 103837 | 0 |
| C | 0 | 87110 | 0 |
| D | 0 | 88099 | 0 |
| Mode M9 | |||
|---|---|---|---|
| Quadrant | BADHDUFLAG | Total packets | Discarded packets |
| A | 0 | 57 | 0 |
| B | 0 | 57 | 0 |
| C | 0 | 57 | 0 |
| D | 0 | 57 | 0 |
| Mode SS | |||
|---|---|---|---|
| Quadrant | BADHDUFLAG | Total packets | Discarded packets |
| A | 0 | 824 | 0 |
| B | 0 | 824 | 0 |
| C | 0 | 824 | 0 |
| D | 0 | 824 | 0 |
| Quadrant | Total seconds | Saturated seconds | Saturation percentage |
|---|---|---|---|
| A | 40291 | 351 | 0.871162% |
| B | 40291 | 2425 | 6.018714% |
| C | 40291 | 596 | 1.479239% |
| D | 40291 | 424 | 1.052344% |
Noise dominated data is calculated using 1-second bins in cleaned event files. If a bin has >2000 counts, and if more than 50% of those come from <1% of pixels, then it is considered to be noise-dominated and hence unusable.
| Quadrant | # 1 sec bins | Bins with >0 counts | Bins with >2000 counts | High rate bins dominated by noise | Noise dominated (total time) | Noise dominated (detector-on time) | Marked lightcurve |
|---|---|---|---|---|---|---|---|
| A | 46041 | 40293 | 4 | 4 | 0.01% | 0.01% | 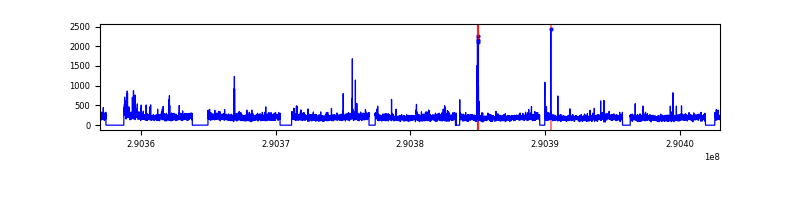 |
| B | 46041 | 40292 | 362 | 362 | 0.79% | 0.90% |  |
| C | 46041 | 40291 | 1 | 1 | 0.00% | 0.00% |  |
| D | 46041 | 40292 | 46 | 46 | 0.10% | 0.11% |  |
Top three noisy pixels from each quadrant. If the there are fewer than three noisy pixels in the level2.evt file, extra rows are filled as -1
| Pixel properties | Quadrant properties | ||||||
|---|---|---|---|---|---|---|---|
| Quadrant | DetID | PixID | Counts | Sigma | Mean | Median | Sigma |
| A | 4 | 2 | 61271 | 128.66 | 2098 | 2064 | 460.2 |
| A | 13 | 254 | 59511 | 124.83 | 2098 | 2064 | 460.2 |
| A | 0 | 13 | 39395 | 81.12 | 2098 | 2064 | 460.2 |
| B | 10 | 245 | 5161212 | 13073.27 | 2080 | 2027 | 394.6 |
| B | 7 | 220 | 73969 | 182.3 | 2080 | 2027 | 394.6 |
| B | 4 | 216 | 46561 | 112.85 | 2080 | 2027 | 394.6 |
| C | 3 | 233 | 1123490 | 2389.88 | 2001 | 1990 | 469.3 |
| C | 9 | 54 | 116680 | 244.4 | 2001 | 1990 | 469.3 |
| C | 0 | 207 | 40266 | 81.56 | 2001 | 1990 | 469.3 |
| D | 1 | 52 | 619224 | 1301.1 | 2042 | 1973 | 474.4 |
| D | 7 | 238 | 472694 | 992.23 | 2042 | 1973 | 474.4 |
| D | 7 | 223 | 222057 | 463.91 | 2042 | 1973 | 474.4 |
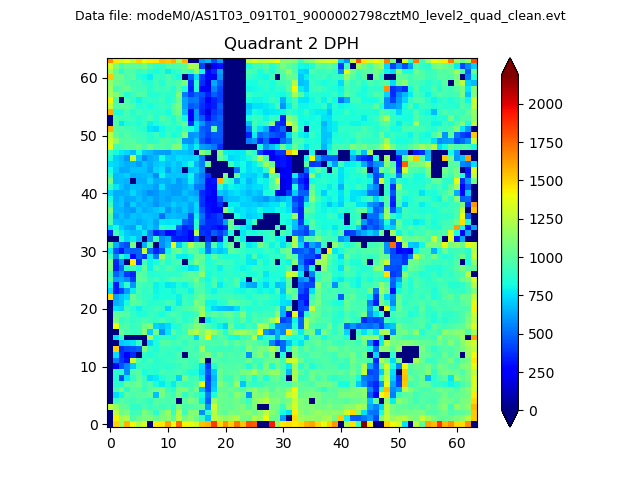
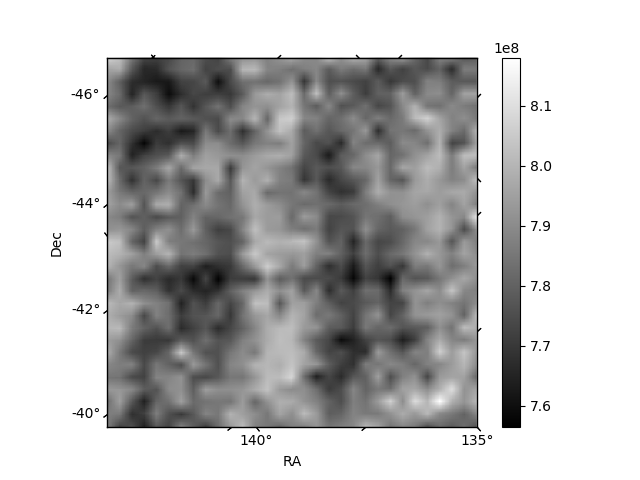
Histogram calculated using DETX and DETY for each event in the final _common_clean file
| Quadrant A |  |
 |
Quadrant B |
|---|---|---|---|
| Quadrant D |  |
 |
Quadrant C |
| Plot type | Count rate plots | Images |
|---|---|---|
| Comparison with Poisson distribution Blue bars denote a histogram of data divided into 1 sec bins. Red curve is a Poisson curve with rate = median count rate of data. |
 |
 |
| Quadrant-wise count rates Data is divided into 100 sec bins |
 |
|
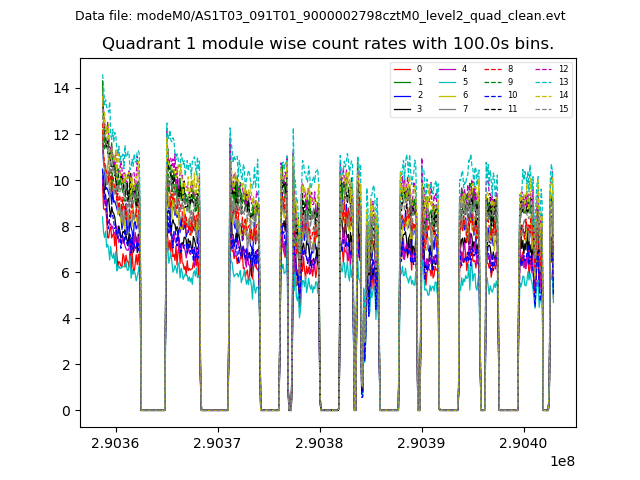
| Module-wise count rates for Quadrant A Data is divided into 100 sec bins |
 |
 |
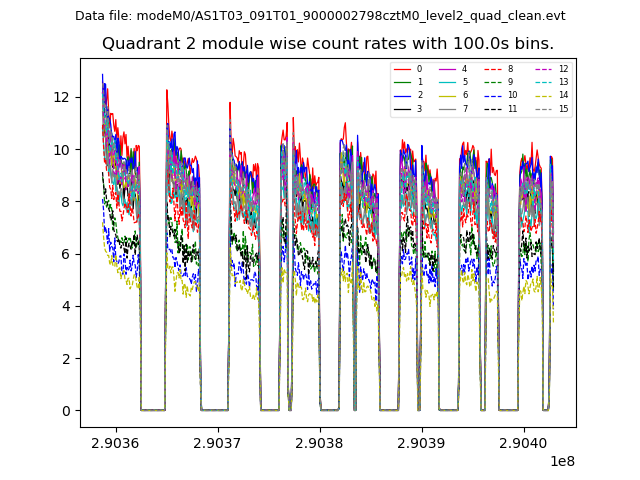
| Module-wise count rates for Quadrant B Data is divided into 100 sec bins |
 |
 |
| Module-wise count rates for Quadrant C Data is divided into 100 sec bins |
 |
 |
| Module-wise count rates for Quadrant D Data is divided into 100 sec bins |
 |
 |
| Parameter | Plot |
|---|---|
| CZT HV Monitor |  |
| D_VDD |  |
| Temperature 1 | 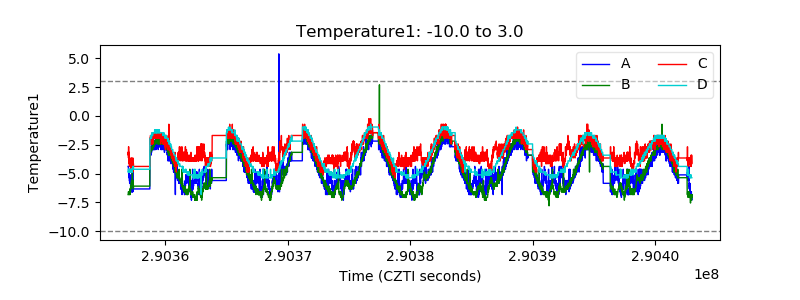 |
| Veto HV Monitor |  |
| Veto LLD |  |
| Alpha Counter | 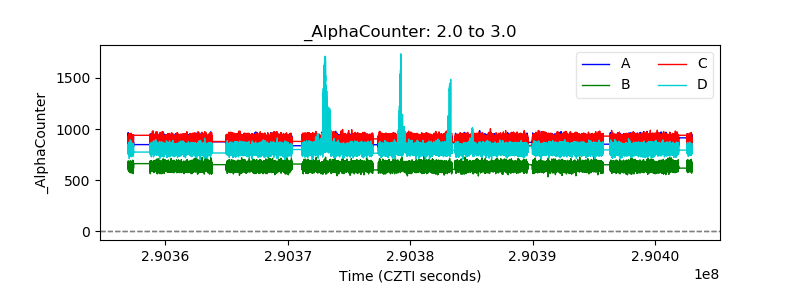 |
| _CPM_Rate |  |
| CZT Counter |  |
| +2.5 Volts monitor |  |
| +5 Volts monitor |  |
| _ROLL_ROT |  |
| _Roll_DEC | 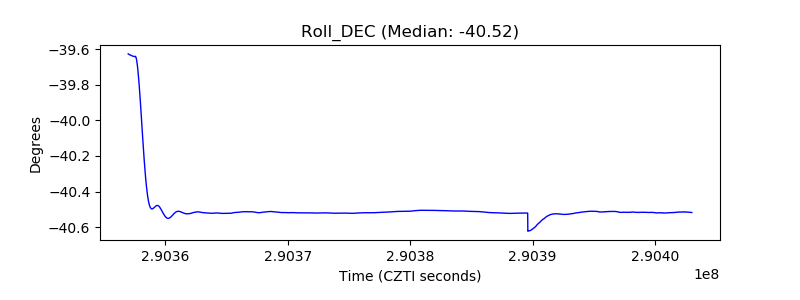 |
| _Roll_RA |  |
| Veto Counter |  |