| Param | Original file | Final file |
|---|---|---|
| Filename | modeM0/AS1A05_072T04_9000002794cztM0_level2_bc.evt | modeM0/AS1A05_072T04_9000002794cztM0_level2_quad_clean.evt |
| Size (bytes) | 2,776,259,520 | 981,800,640 |
| Size | 2.6 GB | 936.3 MB |
| Events in quadrant A | 16,817,154 | 6,206,725 |
| Events in quadrant B | 17,316,122 | 6,309,887 |
| Events in quadrant C | 17,777,032 | 6,141,077 |
| Events in quadrant D | 27,071,987 | 5,950,972 |
| Mode SS | |||
|---|---|---|---|
| Quadrant | BADHDUFLAG | Total packets | Discarded packets |
| A | 0 | 1524 | 0 |
| B | 0 | 1524 | 0 |
| C | 0 | 1524 | 0 |
| D | 0 | 1524 | 0 |
| Mode M9 | |||
|---|---|---|---|
| Quadrant | BADHDUFLAG | Total packets | Discarded packets |
| A | 0 | 124 | 0 |
| B | 0 | 124 | 0 |
| C | 0 | 124 | 0 |
| D | 0 | 124 | 0 |
| Mode M0 | |||
|---|---|---|---|
| Quadrant | BADHDUFLAG | Total packets | Discarded packets |
| A | 0 | 159470 | 0 |
| B | 0 | 162208 | 0 |
| C | 0 | 165902 | 0 |
| D | 0 | 195127 | 0 |
| Quadrant | Total seconds | Saturated seconds | Saturation percentage |
|---|---|---|---|
| A | 74810 | 1047 | 1.399546% |
| B | 74810 | 1237 | 1.653522% |
| C | 74810 | 1776 | 2.374014% |
| D | 74810 | 3041 | 4.064965% |
Noise dominated data is calculated using 1-second bins in cleaned event files. If a bin has >2000 counts, and if more than 50% of those come from <1% of pixels, then it is considered to be noise-dominated and hence unusable.
| Quadrant | # 1 sec bins | Bins with >0 counts | Bins with >2000 counts | High rate bins dominated by noise | Noise dominated (total time) | Noise dominated (detector-on time) | Marked lightcurve |
|---|---|---|---|---|---|---|---|
| A | 87231 | 74809 | 51 | 51 | 0.06% | 0.07% |  |
| B | 87231 | 74808 | 34 | 34 | 0.04% | 0.05% |  |
| C | 87231 | 74812 | 31 | 31 | 0.04% | 0.04% |  |
| D | 87231 | 74812 | 691 | 691 | 0.79% | 0.92% |  |
Top three noisy pixels from each quadrant. If the there are fewer than three noisy pixels in the level2.evt file, extra rows are filled as -1
| Pixel properties | Quadrant properties | ||||||
|---|---|---|---|---|---|---|---|
| Quadrant | DetID | PixID | Counts | Sigma | Mean | Median | Sigma |
| A | 0 | 13 | 454566 | 518.15 | 4048 | 3975 | 869.6 |
| A | 6 | 16 | 385012 | 438.17 | 4048 | 3975 | 869.6 |
| A | 9 | 143 | 221415 | 250.04 | 4048 | 3975 | 869.6 |
| B | 7 | 220 | 418490 | 548.31 | 4085 | 3988 | 756.0 |
| B | 10 | 245 | 287100 | 374.5 | 4085 | 3988 | 756.0 |
| B | 0 | 197 | 170688 | 220.51 | 4085 | 3988 | 756.0 |
| C | 9 | 54 | 1165500 | 1281.47 | 3918 | 3904 | 906.5 |
| C | 3 | 233 | 876341 | 962.47 | 3918 | 3904 | 906.5 |
| C | 5 | 112 | 321017 | 349.84 | 3918 | 3904 | 906.5 |
| D | 1 | 52 | 6977355 | 7566.76 | 3978 | 3841 | 921.6 |
| D | 7 | 238 | 3511019 | 3805.54 | 3978 | 3841 | 921.6 |
| D | 12 | 110 | 982917 | 1062.37 | 3978 | 3841 | 921.6 |
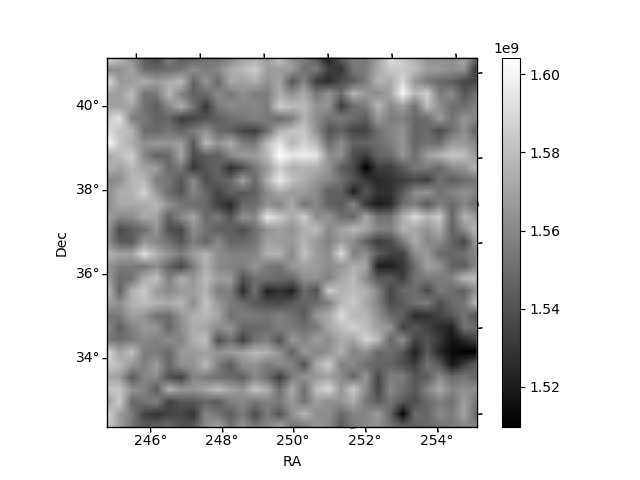
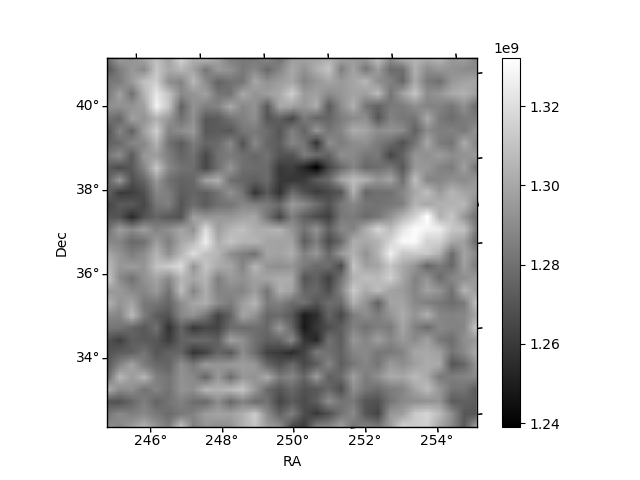
Histogram calculated using DETX and DETY for each event in the final _common_clean file
| Quadrant A |  |
 |
Quadrant B |
|---|---|---|---|
| Quadrant D |  |
 |
Quadrant C |
| Plot type | Count rate plots | Images |
|---|---|---|
| Comparison with Poisson distribution Blue bars denote a histogram of data divided into 1 sec bins. Red curve is a Poisson curve with rate = median count rate of data. |
 |
 |
| Quadrant-wise count rates Data is divided into 100 sec bins |
 |
|
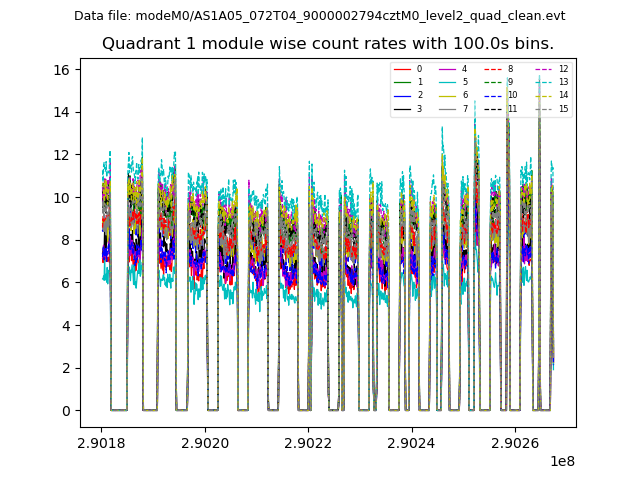
| Module-wise count rates for Quadrant A Data is divided into 100 sec bins |
 |
 |
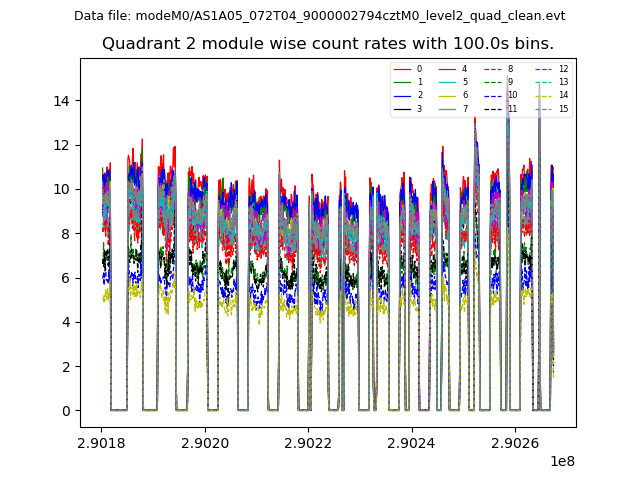
| Module-wise count rates for Quadrant B Data is divided into 100 sec bins |
 |
 |
| Module-wise count rates for Quadrant C Data is divided into 100 sec bins |
 |
 |
| Module-wise count rates for Quadrant D Data is divided into 100 sec bins |
 |
 |
| Parameter | Plot |
|---|---|
| CZT HV Monitor | 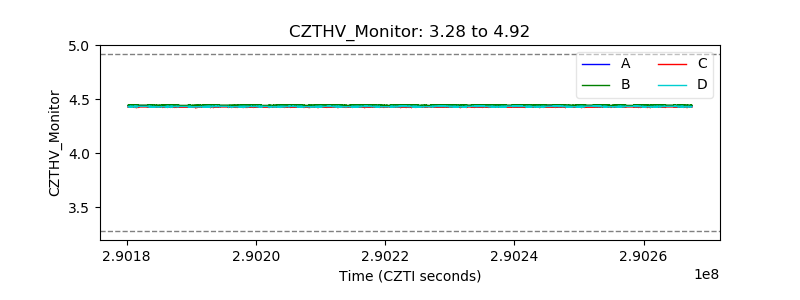 |
| D_VDD |  |
| Temperature 1 |  |
| Veto HV Monitor |  |
| Veto LLD |  |
| Alpha Counter | 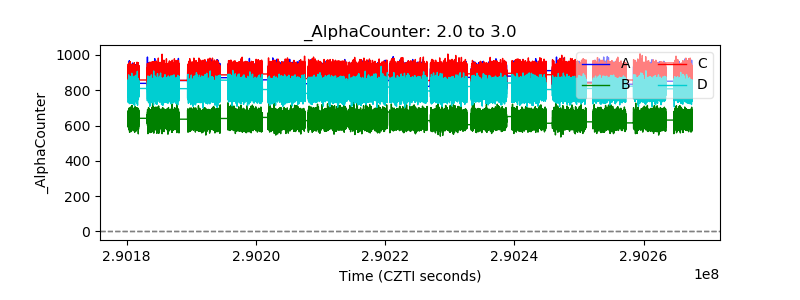 |
| _CPM_Rate | 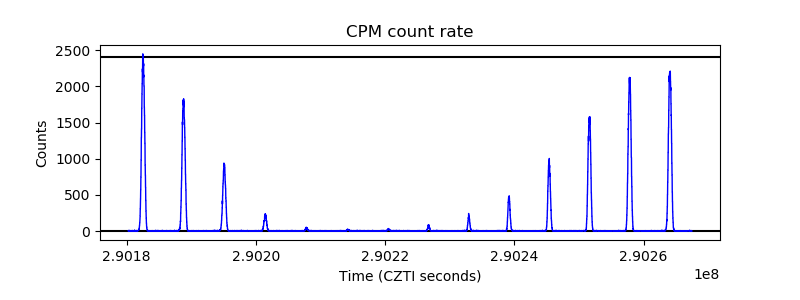 |
| CZT Counter |  |
| +2.5 Volts monitor |  |
| +5 Volts monitor |  |
| _ROLL_ROT |  |
| _Roll_DEC |  |
| _Roll_RA |  |
| Veto Counter |  |