| Param | Original file | Final file |
|---|---|---|
| Filename | modeM0/AS1T03_091T01_9000002790cztM0_level2_bc.evt | modeM0/AS1T03_091T01_9000002790cztM0_level2_quad_clean.evt |
| Size (bytes) | 1,588,216,320 | 575,726,400 |
| Size | 1.5 GB | 549.1 MB |
| Events in quadrant A | 9,110,373 | 3,675,412 |
| Events in quadrant B | 9,941,964 | 3,746,883 |
| Events in quadrant C | 9,461,654 | 3,541,017 |
| Events in quadrant D | 16,535,908 | 3,406,601 |
| Mode SS | |||
|---|---|---|---|
| Quadrant | BADHDUFLAG | Total packets | Discarded packets |
| A | 0 | 910 | 0 |
| B | 0 | 910 | 0 |
| C | 0 | 910 | 0 |
| D | 0 | 910 | 0 |
| Mode M9 | |||
|---|---|---|---|
| Quadrant | BADHDUFLAG | Total packets | Discarded packets |
| A | 0 | 55 | 0 |
| B | 0 | 55 | 0 |
| C | 0 | 55 | 0 |
| D | 0 | 55 | 0 |
| Mode M0 | |||
|---|---|---|---|
| Quadrant | BADHDUFLAG | Total packets | Discarded packets |
| A | 0 | 91833 | 0 |
| B | 0 | 94722 | 0 |
| C | 0 | 94411 | 0 |
| D | 0 | 115152 | 0 |
| Quadrant | Total seconds | Saturated seconds | Saturation percentage |
|---|---|---|---|
| A | 44700 | 299 | 0.668904% |
| B | 44700 | 537 | 1.201342% |
| C | 44700 | 668 | 1.494407% |
| D | 44700 | 1504 | 3.364653% |
Noise dominated data is calculated using 1-second bins in cleaned event files. If a bin has >2000 counts, and if more than 50% of those come from <1% of pixels, then it is considered to be noise-dominated and hence unusable.
| Quadrant | # 1 sec bins | Bins with >0 counts | Bins with >2000 counts | High rate bins dominated by noise | Noise dominated (total time) | Noise dominated (detector-on time) | Marked lightcurve |
|---|---|---|---|---|---|---|---|
| A | 50185 | 44699 | 5 | 5 | 0.01% | 0.01% |  |
| B | 50185 | 44701 | 12 | 12 | 0.02% | 0.03% |  |
| C | 50185 | 44697 | 4 | 4 | 0.01% | 0.01% |  |
| D | 50185 | 44699 | 243 | 243 | 0.48% | 0.54% | 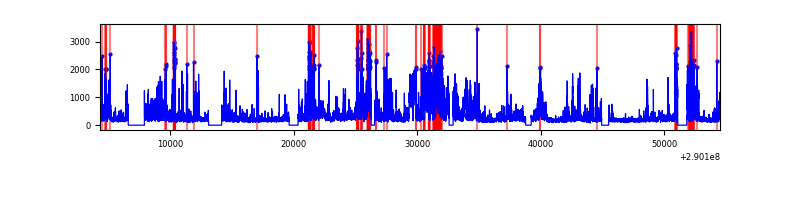 |
Top three noisy pixels from each quadrant. If the there are fewer than three noisy pixels in the level2.evt file, extra rows are filled as -1
| Pixel properties | Quadrant properties | ||||||
|---|---|---|---|---|---|---|---|
| Quadrant | DetID | PixID | Counts | Sigma | Mean | Median | Sigma |
| A | 13 | 254 | 69063 | 130.96 | 2320 | 2281 | 509.9 |
| A | 6 | 16 | 62030 | 117.17 | 2320 | 2281 | 509.9 |
| A | 11 | 29 | 34810 | 63.79 | 2320 | 2281 | 509.9 |
| B | 4 | 80 | 194737 | 429.38 | 2359 | 2303 | 448.2 |
| B | 0 | 197 | 137032 | 300.62 | 2359 | 2303 | 448.2 |
| B | 7 | 220 | 113770 | 248.72 | 2359 | 2303 | 448.2 |
| C | 3 | 233 | 545970 | 1030.07 | 2224 | 2214 | 527.9 |
| C | 9 | 54 | 351948 | 662.52 | 2224 | 2214 | 527.9 |
| C | 9 | 221 | 15152 | 24.51 | 2224 | 2214 | 527.9 |
| D | 1 | 52 | 5624031 | 10646.12 | 2241 | 2160 | 528.1 |
| D | 7 | 238 | 1617846 | 3059.62 | 2241 | 2160 | 528.1 |
| D | 12 | 110 | 479785 | 904.48 | 2241 | 2160 | 528.1 |
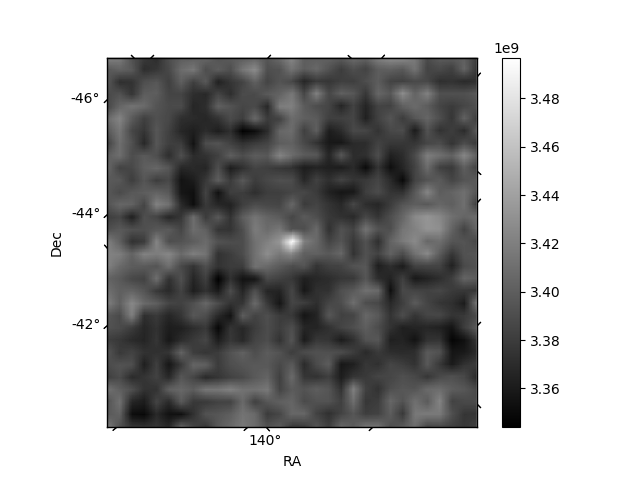
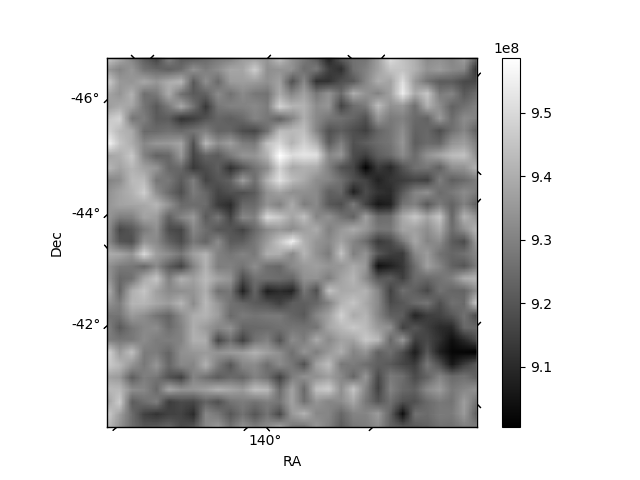
Histogram calculated using DETX and DETY for each event in the final _common_clean file
| Quadrant A |  |
 |
Quadrant B |
|---|---|---|---|
| Quadrant D |  |
 |
Quadrant C |
| Plot type | Count rate plots | Images |
|---|---|---|
| Comparison with Poisson distribution Blue bars denote a histogram of data divided into 1 sec bins. Red curve is a Poisson curve with rate = median count rate of data. |
 |
 |
| Quadrant-wise count rates Data is divided into 100 sec bins |
 |
|
| Module-wise count rates for Quadrant A Data is divided into 100 sec bins |
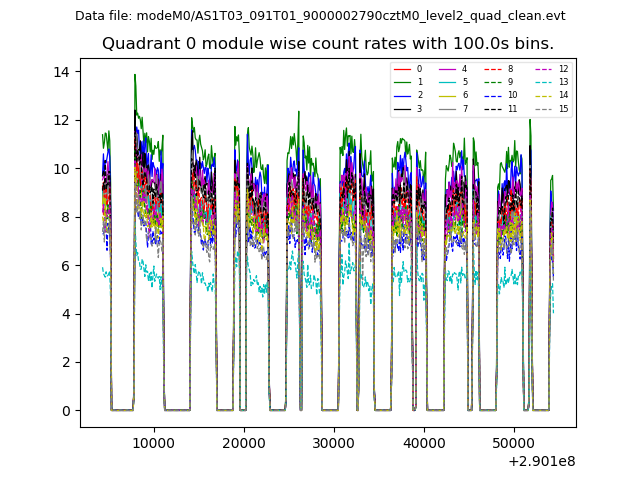 |
 |
| Module-wise count rates for Quadrant B Data is divided into 100 sec bins |
 |
 |
| Module-wise count rates for Quadrant C Data is divided into 100 sec bins |
 |
 |
| Module-wise count rates for Quadrant D Data is divided into 100 sec bins |
 |
 |
| Parameter | Plot |
|---|---|
| CZT HV Monitor |  |
| D_VDD |  |
| Temperature 1 |  |
| Veto HV Monitor | 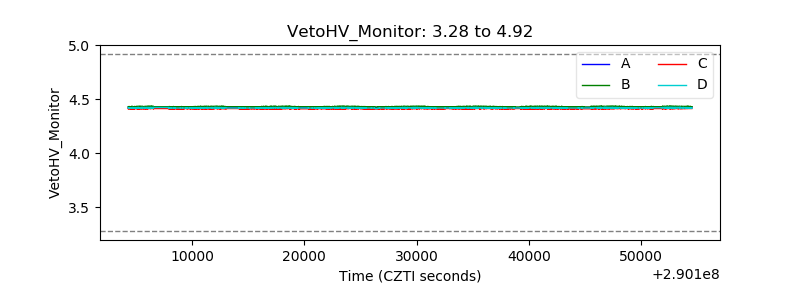 |
| Veto LLD |  |
| Alpha Counter | 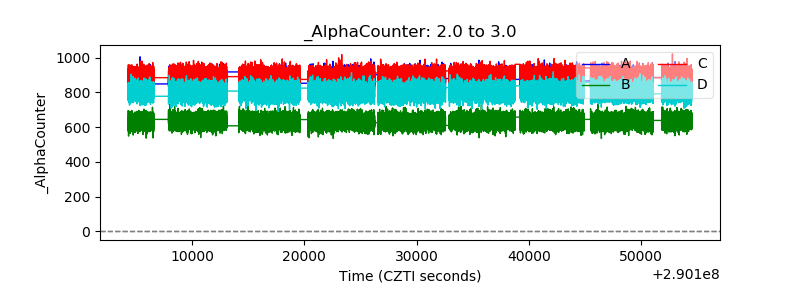 |
| _CPM_Rate | 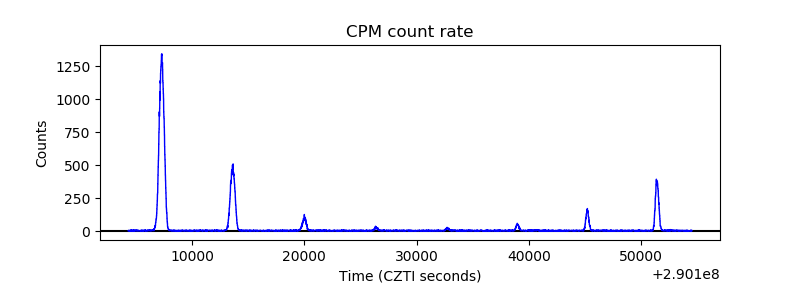 |
| CZT Counter |  |
| +2.5 Volts monitor | 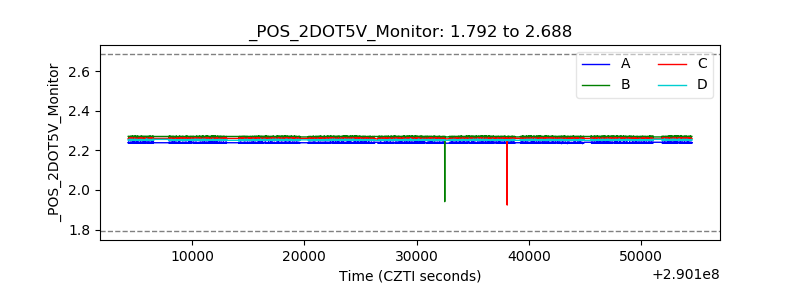 |
| +5 Volts monitor |  |
| _ROLL_ROT |  |
| _Roll_DEC |  |
| _Roll_RA |  |
| Veto Counter |  |