| Param | Original file | Final file |
|---|---|---|
| Filename | modeM0/AS1A06_005T01_9000002788cztM0_level2_bc.evt | modeM0/AS1A06_005T01_9000002788cztM0_level2_quad_clean.evt |
| Size (bytes) | 2,770,205,760 | 810,069,120 |
| Size | 2.6 GB | 772.5 MB |
| Events in quadrant A | 13,237,905 | 5,468,487 |
| Events in quadrant B | 13,271,402 | 5,547,983 |
| Events in quadrant C | 12,512,409 | 5,286,074 |
| Events in quadrant D | 40,810,910 | 4,140,950 |
| Mode SS | |||
|---|---|---|---|
| Quadrant | BADHDUFLAG | Total packets | Discarded packets |
| A | 0 | 1210 | 0 |
| B | 0 | 1210 | 0 |
| C | 0 | 1210 | 0 |
| D | 0 | 1210 | 0 |
| Mode M9 | |||
|---|---|---|---|
| Quadrant | BADHDUFLAG | Total packets | Discarded packets |
| A | 0 | 92 | 0 |
| B | 0 | 92 | 0 |
| C | 0 | 92 | 0 |
| D | 0 | 92 | 0 |
| Mode M0 | |||
|---|---|---|---|
| Quadrant | BADHDUFLAG | Total packets | Discarded packets |
| A | 0 | 126022 | 0 |
| B | 0 | 125815 | 0 |
| C | 0 | 125285 | 0 |
| D | 0 | 246437 | 0 |
| Quadrant | Total seconds | Saturated seconds | Saturation percentage |
|---|---|---|---|
| A | 59615 | 600 | 1.006458% |
| B | 59616 | 765 | 1.283213% |
| C | 59616 | 910 | 1.526436% |
| D | 59615 | 14597 | 24.485448% |
Noise dominated data is calculated using 1-second bins in cleaned event files. If a bin has >2000 counts, and if more than 50% of those come from <1% of pixels, then it is considered to be noise-dominated and hence unusable.
| Quadrant | # 1 sec bins | Bins with >0 counts | Bins with >2000 counts | High rate bins dominated by noise | Noise dominated (total time) | Noise dominated (detector-on time) | Marked lightcurve |
|---|---|---|---|---|---|---|---|
| A | 68636 | 59614 | 3 | 3 | 0.00% | 0.01% | 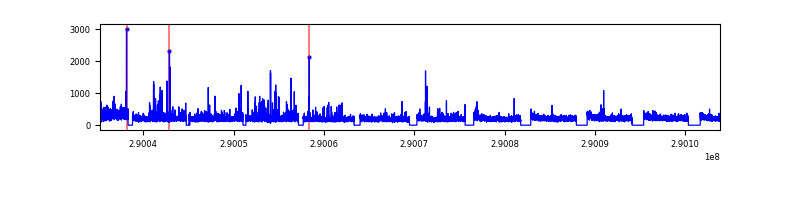 |
| B | 68636 | 59611 | 8 | 8 | 0.01% | 0.01% |  |
| C | 68636 | 59611 | 3 | 3 | 0.00% | 0.01% |  |
| D | 68636 | 59604 | 3169 | 3169 | 4.62% | 5.32% |  |
Top three noisy pixels from each quadrant. If the there are fewer than three noisy pixels in the level2.evt file, extra rows are filled as -1
| Pixel properties | Quadrant properties | ||||||
|---|---|---|---|---|---|---|---|
| Quadrant | DetID | PixID | Counts | Sigma | Mean | Median | Sigma |
| A | 15 | 192 | 598411 | 866.47 | 3176 | 3117 | 687.0 |
| A | 6 | 16 | 236561 | 339.79 | 3176 | 3117 | 687.0 |
| A | 13 | 254 | 89487 | 125.71 | 3176 | 3117 | 687.0 |
| B | 10 | 245 | 242649 | 397.69 | 3214 | 3139 | 602.3 |
| B | 4 | 80 | 188614 | 307.97 | 3214 | 3139 | 602.3 |
| B | 0 | 189 | 102043 | 164.22 | 3214 | 3139 | 602.3 |
| C | 3 | 233 | 451117 | 625.43 | 3053 | 3041 | 716.4 |
| C | 9 | 221 | 164562 | 225.45 | 3053 | 3041 | 716.4 |
| C | 9 | 54 | 145379 | 198.68 | 3053 | 3041 | 716.4 |
| D | 7 | 238 | 27992702 | 45105.57 | 2658 | 2566 | 620.5 |
| D | 1 | 52 | 2121014 | 3413.84 | 2658 | 2566 | 620.5 |
| D | 12 | 110 | 262591 | 419.02 | 2658 | 2566 | 620.5 |
Histogram calculated using DETX and DETY for each event in the final _common_clean file
| Quadrant A |  |
 |
Quadrant B |
|---|---|---|---|
| Quadrant D |  |
 |
Quadrant C |
| Plot type | Count rate plots | Images |
|---|---|---|
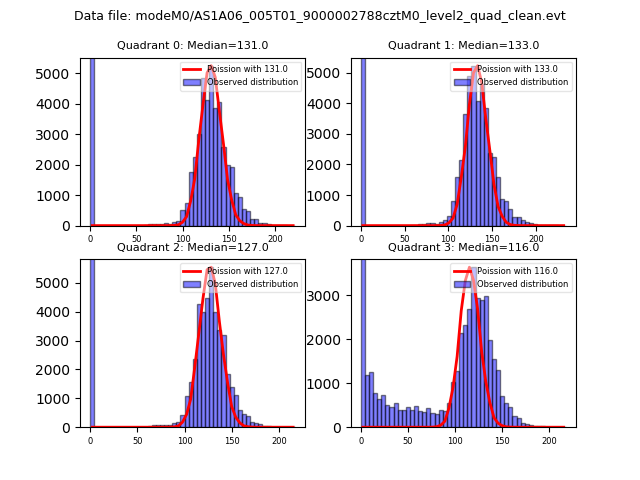
| Comparison with Poisson distribution Blue bars denote a histogram of data divided into 1 sec bins. Red curve is a Poisson curve with rate = median count rate of data. |
 |
 |
| Quadrant-wise count rates Data is divided into 100 sec bins |
 |
|
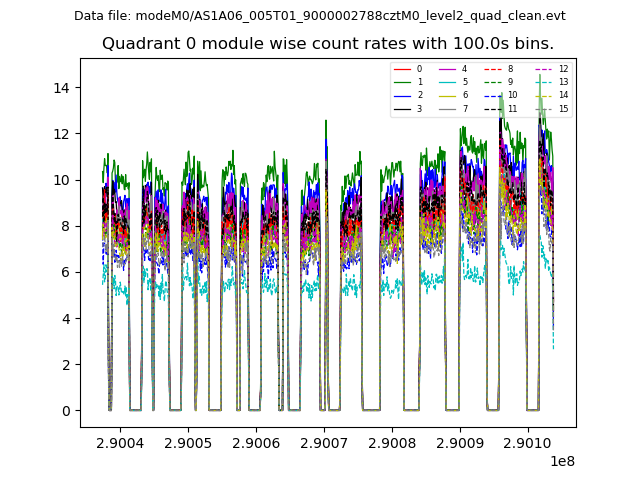
| Module-wise count rates for Quadrant A Data is divided into 100 sec bins |
 |
 |
| Module-wise count rates for Quadrant B Data is divided into 100 sec bins |
 |
 |
| Module-wise count rates for Quadrant C Data is divided into 100 sec bins |
 |
 |
| Module-wise count rates for Quadrant D Data is divided into 100 sec bins |
 |
 |
| Parameter | Plot |
|---|---|
| CZT HV Monitor | 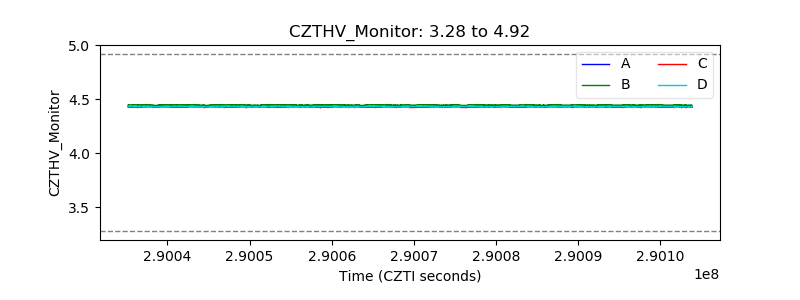 |
| D_VDD |  |
| Temperature 1 |  |
| Veto HV Monitor |  |
| Veto LLD |  |
| Alpha Counter |  |
| _CPM_Rate |  |
| CZT Counter |  |
| +2.5 Volts monitor | 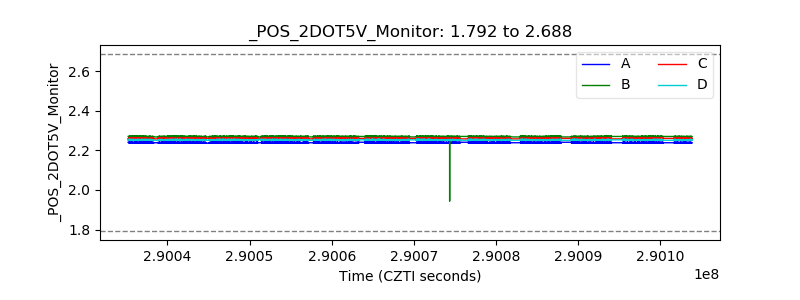 |
| +5 Volts monitor |  |
| _ROLL_ROT |  |
| _Roll_DEC | 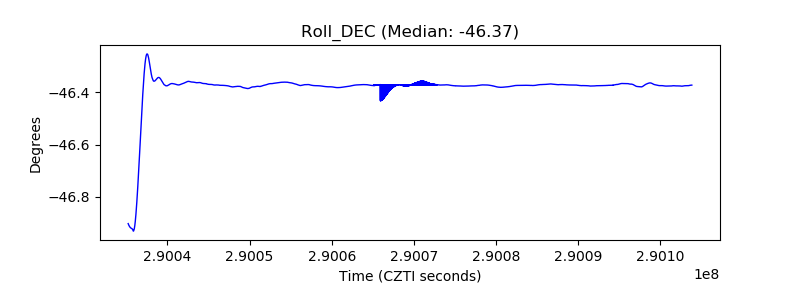 |
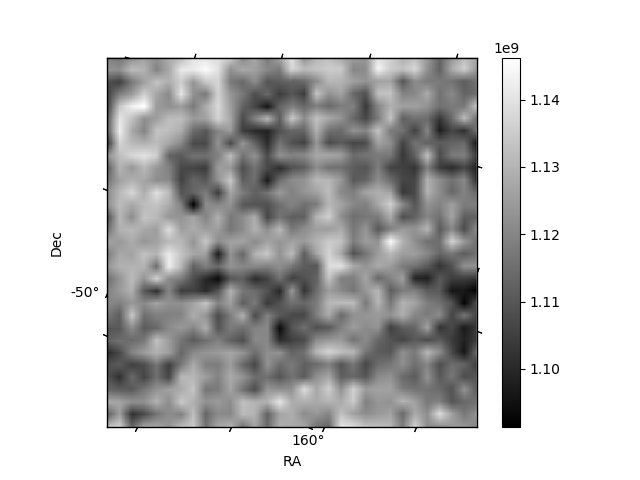
| _Roll_RA |  |
| Veto Counter |  |