| Param | Original file | Final file |
|---|---|---|
| Filename | modeM0/AS1A06_003T01_9000002786cztM0_level2_bc.evt | modeM0/AS1A06_003T01_9000002786cztM0_level2_quad_clean.evt |
| Size (bytes) | 4,047,909,120 | 1,134,368,640 |
| Size | 3.8 GB | 1.1 GB |
| Events in quadrant A | 25,631,327 | 7,179,173 |
| Events in quadrant B | 20,116,728 | 7,343,677 |
| Events in quadrant C | 20,944,781 | 7,139,830 |
| Events in quadrant D | 49,677,879 | 6,428,346 |
| Mode SS | |||
|---|---|---|---|
| Quadrant | BADHDUFLAG | Total packets | Discarded packets |
| A | 0 | 1862 | 0 |
| B | 0 | 1862 | 0 |
| C | 0 | 1862 | 0 |
| D | 0 | 1862 | 0 |
| Mode M0 | |||
|---|---|---|---|
| Quadrant | BADHDUFLAG | Total packets | Discarded packets |
| A | 0 | 210270 | 0 |
| B | 0 | 194127 | 0 |
| C | 0 | 199685 | 0 |
| D | 0 | 295788 | 0 |
| Mode M9 | |||
|---|---|---|---|
| Quadrant | BADHDUFLAG | Total packets | Discarded packets |
| A | 0 | 158 | 0 |
| B | 0 | 158 | 0 |
| C | 0 | 158 | 0 |
| D | 0 | 158 | 0 |
| Quadrant | Total seconds | Saturated seconds | Saturation percentage |
|---|---|---|---|
| A | 91398 | 1667 | 1.823891% |
| B | 91399 | 1350 | 1.477040% |
| C | 91399 | 1907 | 2.086456% |
| D | 91399 | 10933 | 11.961838% |
Noise dominated data is calculated using 1-second bins in cleaned event files. If a bin has >2000 counts, and if more than 50% of those come from <1% of pixels, then it is considered to be noise-dominated and hence unusable.
| Quadrant | # 1 sec bins | Bins with >0 counts | Bins with >2000 counts | High rate bins dominated by noise | Noise dominated (total time) | Noise dominated (detector-on time) | Marked lightcurve |
|---|---|---|---|---|---|---|---|
| A | 107213 | 91395 | 292 | 292 | 0.27% | 0.32% |  |
| B | 107214 | 91392 | 23 | 23 | 0.02% | 0.03% |  |
| C | 107214 | 91396 | 52 | 52 | 0.05% | 0.06% | 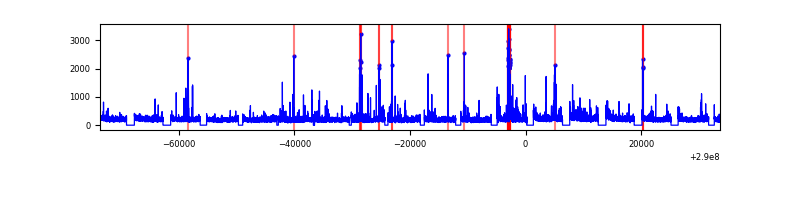 |
| D | 107214 | 91394 | 4821 | 4821 | 4.50% | 5.27% |  |
Top three noisy pixels from each quadrant. If the there are fewer than three noisy pixels in the level2.evt file, extra rows are filled as -1
| Pixel properties | Quadrant properties | ||||||
|---|---|---|---|---|---|---|---|
| Quadrant | DetID | PixID | Counts | Sigma | Mean | Median | Sigma |
| A | 0 | 13 | 6163263 | 5806.95 | 4925 | 4842 | 1060.5 |
| A | 6 | 16 | 298040 | 276.46 | 4925 | 4842 | 1060.5 |
| A | 13 | 254 | 116321 | 105.12 | 4925 | 4842 | 1060.5 |
| B | 0 | 230 | 153363 | 159.1 | 5005 | 4882 | 933.3 |
| B | 4 | 216 | 149937 | 155.43 | 5005 | 4882 | 933.3 |
| B | 3 | 64 | 138198 | 142.85 | 5005 | 4882 | 933.3 |
| C | 9 | 54 | 814645 | 713.44 | 4852 | 4827 | 1135.1 |
| C | 9 | 221 | 765419 | 670.07 | 4852 | 4827 | 1135.1 |
| C | 3 | 233 | 702593 | 614.72 | 4852 | 4827 | 1135.1 |
| D | 7 | 238 | 17328239 | 16032.9 | 4670 | 4508 | 1080.5 |
| D | 1 | 52 | 12232661 | 11317.0 | 4670 | 4508 | 1080.5 |
| D | 13 | 168 | 1251065 | 1153.67 | 4670 | 4508 | 1080.5 |
Histogram calculated using DETX and DETY for each event in the final _common_clean file
| Quadrant A | 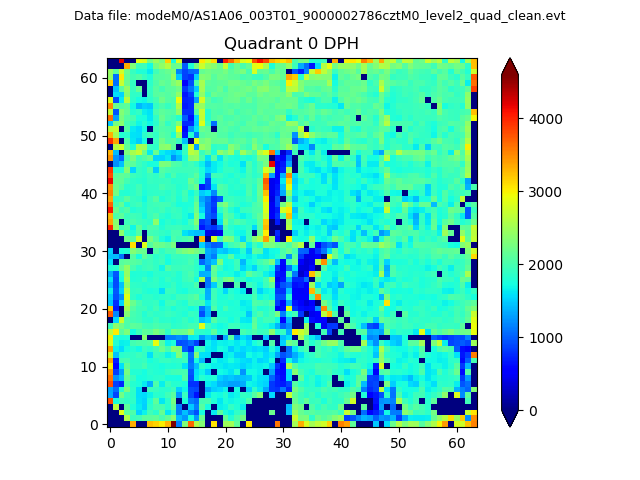 |
 |
Quadrant B |
|---|---|---|---|
| Quadrant D |  |
 |
Quadrant C |
| Plot type | Count rate plots | Images |
|---|---|---|
| Comparison with Poisson distribution Blue bars denote a histogram of data divided into 1 sec bins. Red curve is a Poisson curve with rate = median count rate of data. |
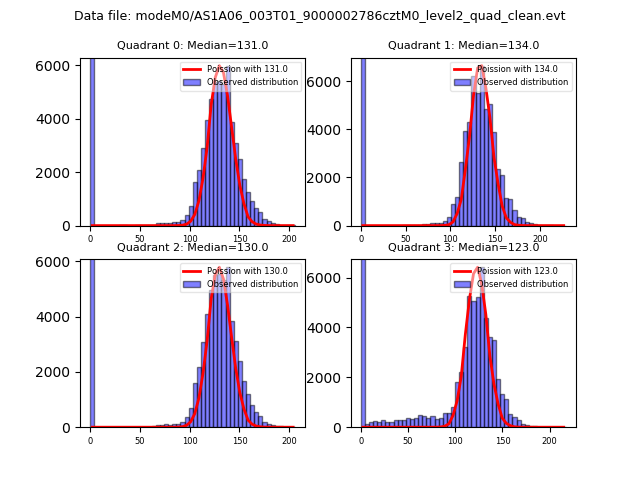 |
 |
| Quadrant-wise count rates Data is divided into 100 sec bins |
 |
|
| Module-wise count rates for Quadrant A Data is divided into 100 sec bins |
 |
 |
| Module-wise count rates for Quadrant B Data is divided into 100 sec bins |
 |
 |
| Module-wise count rates for Quadrant C Data is divided into 100 sec bins |
 |
 |
| Module-wise count rates for Quadrant D Data is divided into 100 sec bins |
 |
 |
| Parameter | Plot |
|---|---|
| CZT HV Monitor | 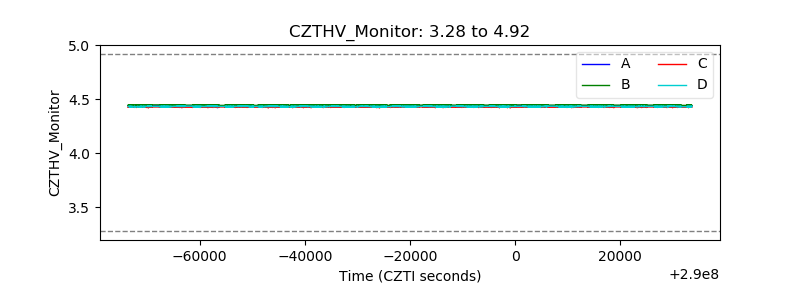 |
| D_VDD | 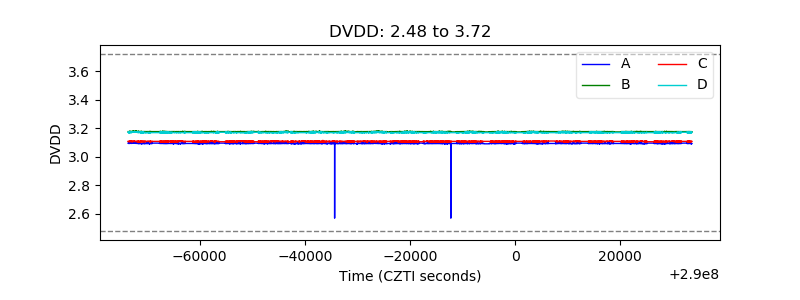 |
| Temperature 1 |  |
| Veto HV Monitor |  |
| Veto LLD |  |
| Alpha Counter |  |
| _CPM_Rate |  |
| CZT Counter |  |
| +2.5 Volts monitor | 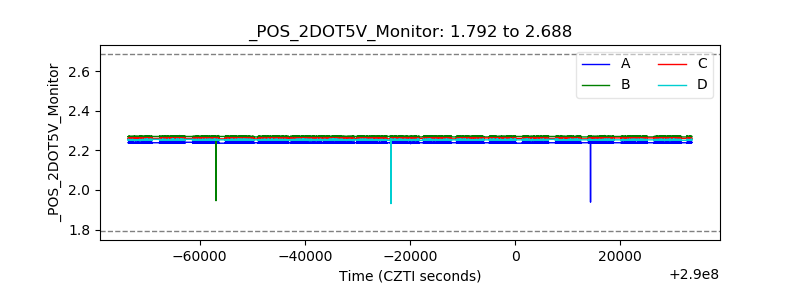 |
| +5 Volts monitor |  |
| _ROLL_ROT |  |
| _Roll_DEC |  |
| _Roll_RA | 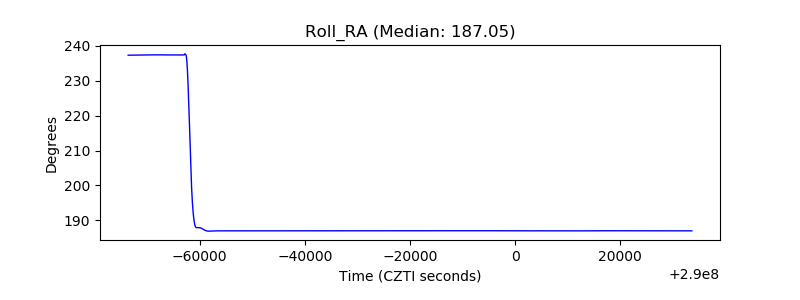 |
| Veto Counter |  |