| Param | Original file | Final file |
|---|---|---|
| Filename | modeM0/AS1A05_118T04_9000002782cztM0_level2_bc.evt | modeM0/AS1A05_118T04_9000002782cztM0_level2_quad_clean.evt |
| Size (bytes) | 696,856,320 | 279,904,320 |
| Size | 664.6 MB | 266.9 MB |
| Events in quadrant A | 4,507,390 | 1,821,114 |
| Events in quadrant B | 4,292,617 | 1,865,642 |
| Events in quadrant C | 4,319,408 | 1,807,188 |
| Events in quadrant D | 6,762,687 | 1,753,857 |
| Mode M0 | |||
|---|---|---|---|
| Quadrant | BADHDUFLAG | Total packets | Discarded packets |
| A | 0 | 40378 | 0 |
| B | 0 | 39363 | 0 |
| C | 0 | 40168 | 0 |
| D | 0 | 47298 | 0 |
| Mode M9 | |||
|---|---|---|---|
| Quadrant | BADHDUFLAG | Total packets | Discarded packets |
| A | 0 | 48 | 0 |
| B | 0 | 48 | 0 |
| C | 0 | 48 | 0 |
| D | 0 | 48 | 0 |
| Mode SS | |||
|---|---|---|---|
| Quadrant | BADHDUFLAG | Total packets | Discarded packets |
| A | 0 | 366 | 0 |
| B | 0 | 366 | 0 |
| C | 0 | 366 | 0 |
| D | 0 | 366 | 0 |
| Quadrant | Total seconds | Saturated seconds | Saturation percentage |
|---|---|---|---|
| A | 17849 | 380 | 2.128971% |
| B | 17849 | 292 | 1.635946% |
| C | 17849 | 391 | 2.190599% |
| D | 17849 | 549 | 3.075803% |
Noise dominated data is calculated using 1-second bins in cleaned event files. If a bin has >2000 counts, and if more than 50% of those come from <1% of pixels, then it is considered to be noise-dominated and hence unusable.
| Quadrant | # 1 sec bins | Bins with >0 counts | Bins with >2000 counts | High rate bins dominated by noise | Noise dominated (total time) | Noise dominated (detector-on time) | Marked lightcurve |
|---|---|---|---|---|---|---|---|
| A | 22669 | 17845 | 14 | 14 | 0.06% | 0.08% | 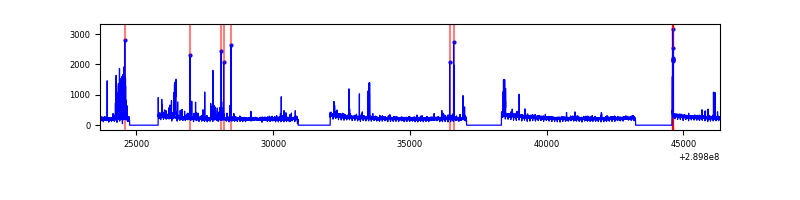 |
| B | 22669 | 17846 | 0 | 0 | 0.00% | 0.00% | 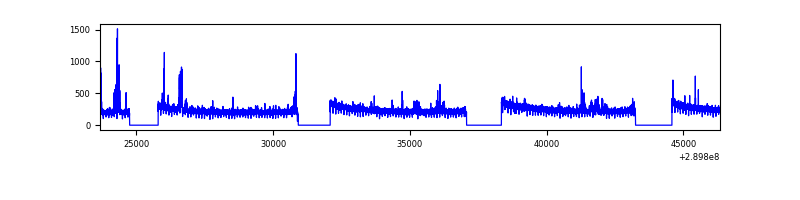 |
| C | 22669 | 17845 | 1 | 1 | 0.00% | 0.01% | 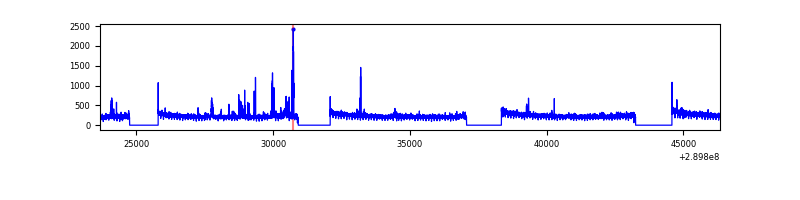 |
| D | 22669 | 17846 | 110 | 110 | 0.49% | 0.62% |  |
Top three noisy pixels from each quadrant. If the there are fewer than three noisy pixels in the level2.evt file, extra rows are filled as -1
| Pixel properties | Quadrant properties | ||||||
|---|---|---|---|---|---|---|---|
| Quadrant | DetID | PixID | Counts | Sigma | Mean | Median | Sigma |
| A | 0 | 13 | 169602 | 747.31 | 1060 | 1043 | 225.6 |
| A | 14 | 111 | 109077 | 478.97 | 1060 | 1043 | 225.6 |
| A | 6 | 16 | 69347 | 302.83 | 1060 | 1043 | 225.6 |
| B | 0 | 230 | 93042 | 463.72 | 1078 | 1055 | 198.4 |
| B | 0 | 229 | 32508 | 158.56 | 1078 | 1055 | 198.4 |
| B | 4 | 80 | 28280 | 137.24 | 1078 | 1055 | 198.4 |
| C | 9 | 54 | 139133 | 574.36 | 1043 | 1041 | 240.4 |
| C | 3 | 233 | 127939 | 527.8 | 1043 | 1041 | 240.4 |
| C | 9 | 221 | 43718 | 177.5 | 1043 | 1041 | 240.4 |
| D | 1 | 52 | 1595776 | 6768.35 | 1053 | 1021 | 235.6 |
| D | 7 | 238 | 618175 | 2619.28 | 1053 | 1021 | 235.6 |
| D | 14 | 34 | 488851 | 2070.42 | 1053 | 1021 | 235.6 |
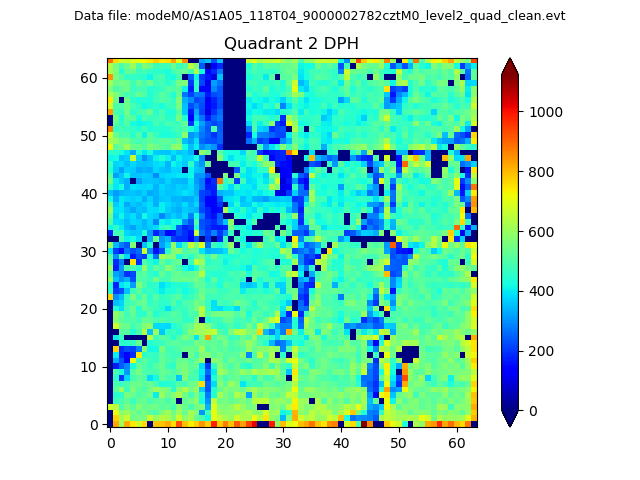
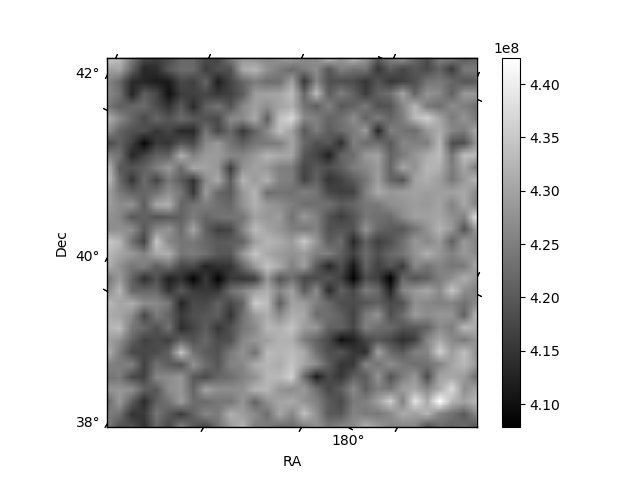
Histogram calculated using DETX and DETY for each event in the final _common_clean file
| Quadrant A |  |
 |
Quadrant B |
|---|---|---|---|
| Quadrant D |  |
 |
Quadrant C |
| Plot type | Count rate plots | Images |
|---|---|---|
| Comparison with Poisson distribution Blue bars denote a histogram of data divided into 1 sec bins. Red curve is a Poisson curve with rate = median count rate of data. |
 |
 |
| Quadrant-wise count rates Data is divided into 100 sec bins |
 |
|
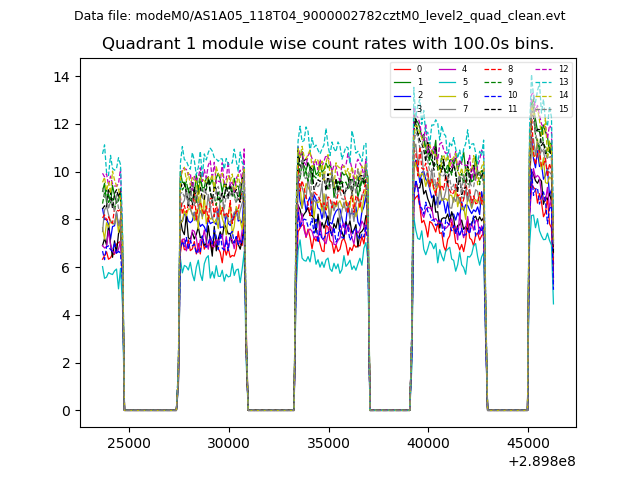
| Module-wise count rates for Quadrant A Data is divided into 100 sec bins |
 |
 |
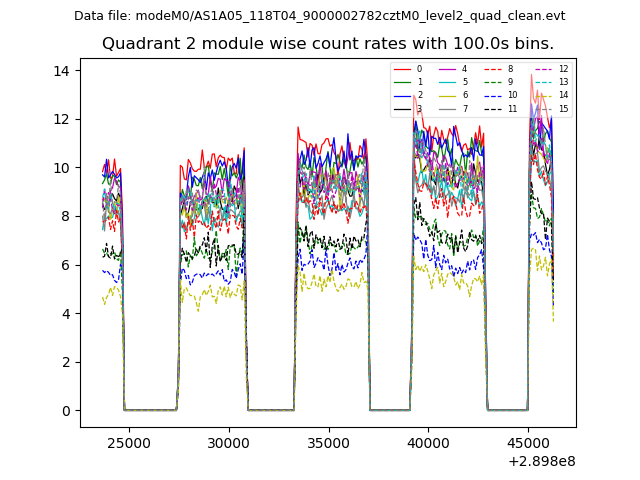
| Module-wise count rates for Quadrant B Data is divided into 100 sec bins |
 |
 |
| Module-wise count rates for Quadrant C Data is divided into 100 sec bins |
 |
 |
| Module-wise count rates for Quadrant D Data is divided into 100 sec bins |
 |
 |
| Parameter | Plot |
|---|---|
| CZT HV Monitor |  |
| D_VDD |  |
| Temperature 1 |  |
| Veto HV Monitor |  |
| Veto LLD |  |
| Alpha Counter |  |
| _CPM_Rate | 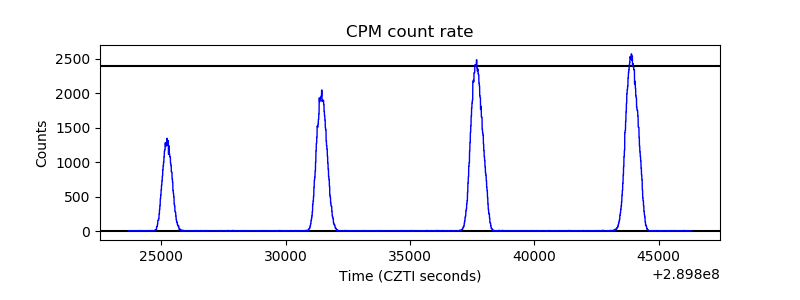 |
| CZT Counter |  |
| +2.5 Volts monitor | 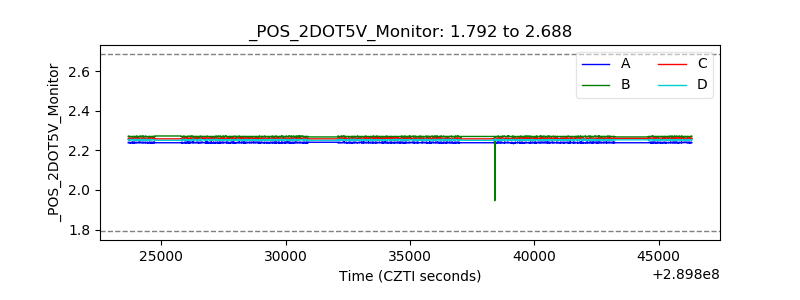 |
| +5 Volts monitor | 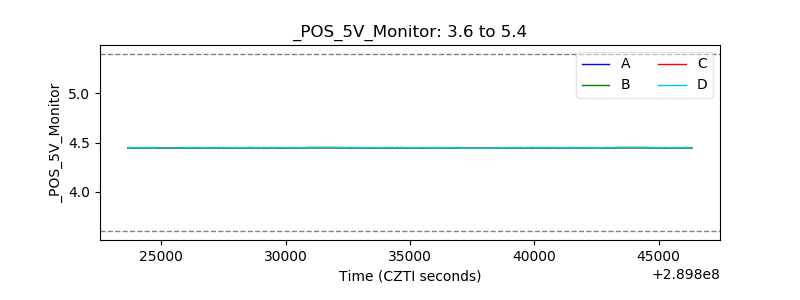 |
| _ROLL_ROT |  |
| _Roll_DEC |  |
| _Roll_RA |  |
| Veto Counter |  |