| Param | Original file | Final file |
|---|---|---|
| Filename | modeM0/AS1A05_212T06_9000002776cztM0_level2_bc.evt | modeM0/AS1A05_212T06_9000002776cztM0_level2_quad_clean.evt |
| Size (bytes) | 198,717,120 | 91,535,040 |
| Size | 189.5 MB | 87.3 MB |
| Events in quadrant A | 1,375,116 | 592,166 |
| Events in quadrant B | 1,318,558 | 613,394 |
| Events in quadrant C | 1,208,402 | 587,540 |
| Events in quadrant D | 1,705,192 | 565,737 |
| Mode M9 | |||
|---|---|---|---|
| Quadrant | BADHDUFLAG | Total packets | Discarded packets |
| A | 0 | 11 | 0 |
| B | 0 | 11 | 0 |
| C | 0 | 11 | 0 |
| D | 0 | 11 | 0 |
| Mode M0 | |||
|---|---|---|---|
| Quadrant | BADHDUFLAG | Total packets | Discarded packets |
| A | 0 | 12650 | 0 |
| B | 0 | 12571 | 0 |
| C | 0 | 12254 | 0 |
| D | 0 | 13678 | 0 |
| Mode SS | |||
|---|---|---|---|
| Quadrant | BADHDUFLAG | Total packets | Discarded packets |
| A | 0 | 120 | 0 |
| B | 0 | 120 | 0 |
| C | 0 | 120 | 0 |
| D | 0 | 120 | 0 |
| Quadrant | Total seconds | Saturated seconds | Saturation percentage |
|---|---|---|---|
| A | 5916 | 40 | 0.676133% |
| B | 5916 | 55 | 0.929682% |
| C | 5916 | 53 | 0.895876% |
| D | 5916 | 63 | 1.064909% |
Noise dominated data is calculated using 1-second bins in cleaned event files. If a bin has >2000 counts, and if more than 50% of those come from <1% of pixels, then it is considered to be noise-dominated and hence unusable.
| Quadrant | # 1 sec bins | Bins with >0 counts | Bins with >2000 counts | High rate bins dominated by noise | Noise dominated (total time) | Noise dominated (detector-on time) | Marked lightcurve |
|---|---|---|---|---|---|---|---|
| A | 7026 | 5916 | 0 | 0 | 0.00% | 0.00% |  |
| B | 7026 | 5916 | 0 | 0 | 0.00% | 0.00% |  |
| C | 7026 | 5916 | 0 | 0 | 0.00% | 0.00% | 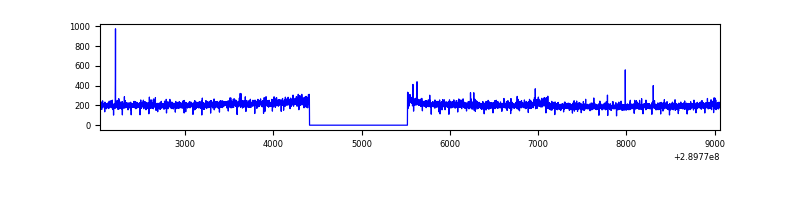 |
| D | 7026 | 5916 | 13 | 13 | 0.19% | 0.22% |  |
Top three noisy pixels from each quadrant. If the there are fewer than three noisy pixels in the level2.evt file, extra rows are filled as -1
| Pixel properties | Quadrant properties | ||||||
|---|---|---|---|---|---|---|---|
| Quadrant | DetID | PixID | Counts | Sigma | Mean | Median | Sigma |
| A | 0 | 13 | 138835 | 2008.49 | 313 | 307 | 69.0 |
| A | 9 | 143 | 26193 | 375.32 | 313 | 307 | 69.0 |
| A | 13 | 254 | 9794 | 137.55 | 313 | 307 | 69.0 |
| B | 0 | 230 | 56232 | 891.16 | 321 | 313 | 62.7 |
| B | 0 | 229 | 13653 | 212.59 | 321 | 313 | 62.7 |
| B | 3 | 64 | 6919 | 105.28 | 321 | 313 | 62.7 |
| C | 3 | 233 | 16845 | 220.92 | 309 | 307 | 74.9 |
| C | 9 | 54 | 4041 | 49.88 | 309 | 307 | 74.9 |
| C | 13 | 61 | 1706 | 18.69 | 309 | 307 | 74.9 |
| D | 1 | 52 | 348881 | 4696.93 | 310 | 298 | 74.2 |
| D | 5 | 222 | 61823 | 829.01 | 310 | 298 | 74.2 |
| D | 7 | 96 | 35112 | 469.1 | 310 | 298 | 74.2 |
Histogram calculated using DETX and DETY for each event in the final _common_clean file
| Quadrant A |  |
 |
Quadrant B |
|---|---|---|---|
| Quadrant D |  |
 |
Quadrant C |
| Plot type | Count rate plots | Images |
|---|---|---|
| Comparison with Poisson distribution Blue bars denote a histogram of data divided into 1 sec bins. Red curve is a Poisson curve with rate = median count rate of data. |
 |
 |
| Quadrant-wise count rates Data is divided into 100 sec bins |
 |
|
| Module-wise count rates for Quadrant A Data is divided into 100 sec bins |
 |
 |
| Module-wise count rates for Quadrant B Data is divided into 100 sec bins |
 |
 |
| Module-wise count rates for Quadrant C Data is divided into 100 sec bins |
 |
 |
| Module-wise count rates for Quadrant D Data is divided into 100 sec bins |
 |
 |
| Parameter | Plot |
|---|---|
| CZT HV Monitor |  |
| D_VDD |  |
| Temperature 1 |  |
| Veto HV Monitor |  |
| Veto LLD |  |
| Alpha Counter |  |
| _CPM_Rate |  |
| CZT Counter |  |
| +2.5 Volts monitor |  |
| +5 Volts monitor |  |
| _ROLL_ROT |  |
| _Roll_DEC |  |
| _Roll_RA |  |
| Veto Counter |  |