| Param | Original file | Final file |
|---|---|---|
| Filename | modeM0/AS1A05_083T01_9000002772cztM0_level2_bc.evt | modeM0/AS1A05_083T01_9000002772cztM0_level2_quad_clean.evt |
| Size (bytes) | 642,623,040 | 233,144,640 |
| Size | 612.9 MB | 222.3 MB |
| Events in quadrant A | 4,585,354 | 1,450,271 |
| Events in quadrant B | 4,276,275 | 1,482,579 |
| Events in quadrant C | 4,177,021 | 1,434,106 |
| Events in quadrant D | 5,144,018 | 1,407,394 |
| Mode M9 | |||
|---|---|---|---|
| Quadrant | BADHDUFLAG | Total packets | Discarded packets |
| A | 0 | 41 | 0 |
| B | 0 | 41 | 0 |
| C | 0 | 41 | 0 |
| D | 0 | 41 | 0 |
| Mode M0 | |||
|---|---|---|---|
| Quadrant | BADHDUFLAG | Total packets | Discarded packets |
| A | 0 | 41195 | 0 |
| B | 0 | 40407 | 0 |
| C | 0 | 40515 | 0 |
| D | 0 | 42982 | 0 |
| Mode SS | |||
|---|---|---|---|
| Quadrant | BADHDUFLAG | Total packets | Discarded packets |
| A | 0 | 382 | 0 |
| B | 0 | 382 | 0 |
| C | 0 | 382 | 0 |
| D | 0 | 382 | 0 |
| Quadrant | Total seconds | Saturated seconds | Saturation percentage |
|---|---|---|---|
| A | 18674 | 294 | 1.574381% |
| B | 18674 | 269 | 1.440506% |
| C | 18674 | 346 | 1.852844% |
| D | 18674 | 375 | 2.008140% |
Noise dominated data is calculated using 1-second bins in cleaned event files. If a bin has >2000 counts, and if more than 50% of those come from <1% of pixels, then it is considered to be noise-dominated and hence unusable.
| Quadrant | # 1 sec bins | Bins with >0 counts | Bins with >2000 counts | High rate bins dominated by noise | Noise dominated (total time) | Noise dominated (detector-on time) | Marked lightcurve |
|---|---|---|---|---|---|---|---|
| A | 22799 | 18670 | 39 | 39 | 0.17% | 0.21% |  |
| B | 22799 | 18670 | 0 | 0 | 0.00% | 0.00% |  |
| C | 22799 | 18672 | 2 | 2 | 0.01% | 0.01% | 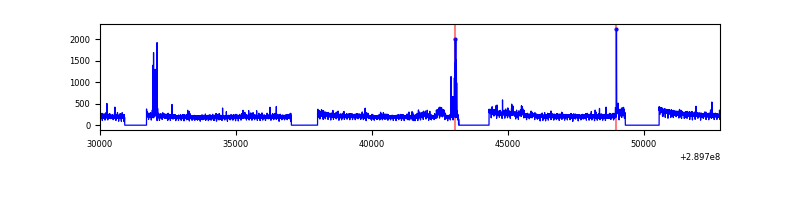 |
| D | 22799 | 18671 | 33 | 33 | 0.14% | 0.18% | 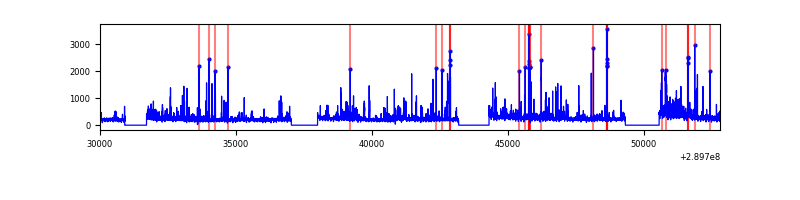 |
Top three noisy pixels from each quadrant. If the there are fewer than three noisy pixels in the level2.evt file, extra rows are filled as -1
| Pixel properties | Quadrant properties | ||||||
|---|---|---|---|---|---|---|---|
| Quadrant | DetID | PixID | Counts | Sigma | Mean | Median | Sigma |
| A | 0 | 13 | 518577 | 2328.39 | 1035 | 1015 | 222.3 |
| A | 13 | 254 | 29634 | 128.75 | 1035 | 1015 | 222.3 |
| A | 9 | 143 | 28692 | 124.51 | 1035 | 1015 | 222.3 |
| B | 0 | 230 | 87537 | 437.34 | 1053 | 1026 | 197.8 |
| B | 0 | 229 | 32889 | 161.08 | 1053 | 1026 | 197.8 |
| B | 0 | 190 | 32586 | 159.54 | 1053 | 1026 | 197.8 |
| C | 3 | 233 | 165615 | 700.46 | 1013 | 1005 | 235.0 |
| C | 9 | 54 | 115182 | 485.85 | 1013 | 1005 | 235.0 |
| C | 13 | 61 | 5914 | 20.89 | 1013 | 1005 | 235.0 |
| D | 1 | 52 | 513643 | 2196.87 | 1029 | 993 | 233.4 |
| D | 5 | 222 | 315887 | 1349.42 | 1029 | 993 | 233.4 |
| D | 7 | 238 | 124121 | 527.64 | 1029 | 993 | 233.4 |
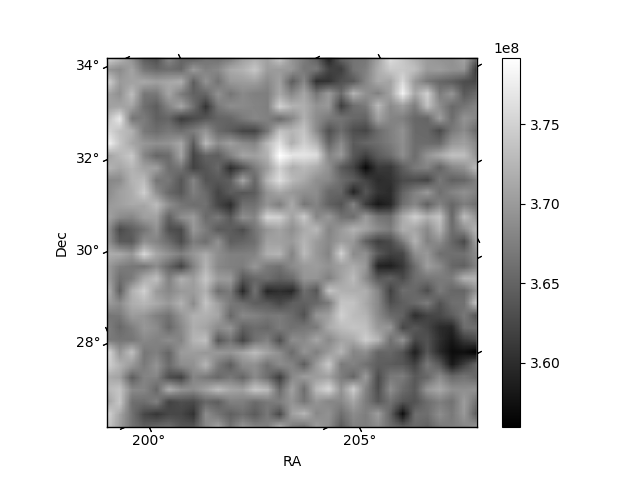
Histogram calculated using DETX and DETY for each event in the final _common_clean file
| Quadrant A | 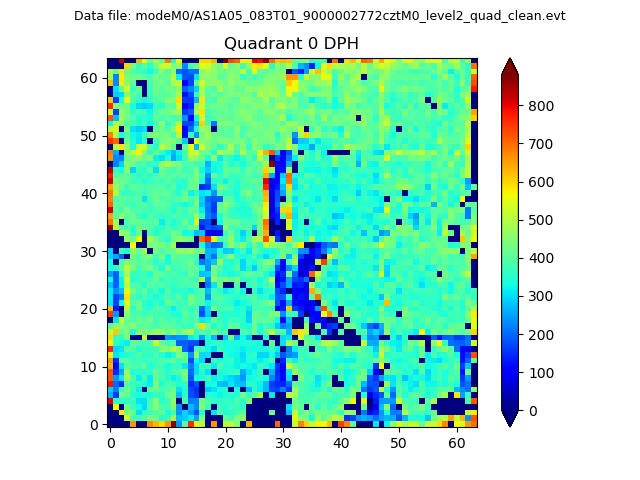 |
 |
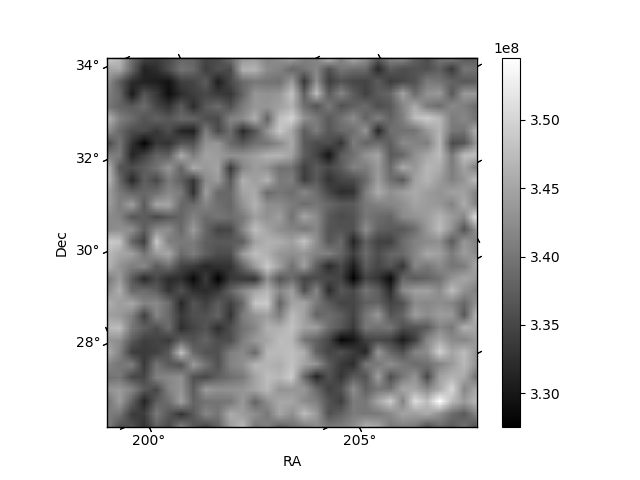
Quadrant B |
|---|---|---|---|
| Quadrant D |  |
 |
Quadrant C |
| Plot type | Count rate plots | Images |
|---|---|---|
| Comparison with Poisson distribution Blue bars denote a histogram of data divided into 1 sec bins. Red curve is a Poisson curve with rate = median count rate of data. |
 |
 |
| Quadrant-wise count rates Data is divided into 100 sec bins |
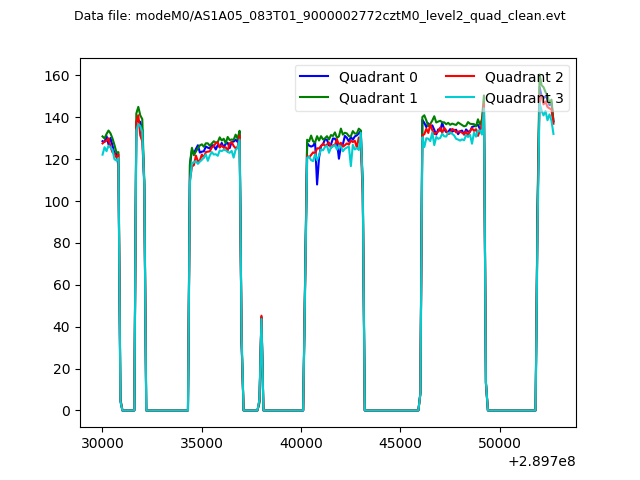 |
|
| Module-wise count rates for Quadrant A Data is divided into 100 sec bins |
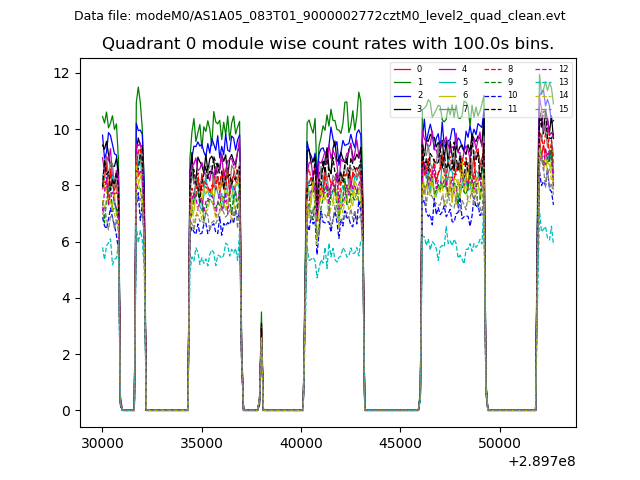 |
 |
| Module-wise count rates for Quadrant B Data is divided into 100 sec bins |
 |
 |
| Module-wise count rates for Quadrant C Data is divided into 100 sec bins |
 |
 |
| Module-wise count rates for Quadrant D Data is divided into 100 sec bins |
 |
 |
| Parameter | Plot |
|---|---|
| CZT HV Monitor |  |
| D_VDD |  |
| Temperature 1 |  |
| Veto HV Monitor |  |
| Veto LLD |  |
| Alpha Counter |  |
| _CPM_Rate |  |
| CZT Counter |  |
| +2.5 Volts monitor | 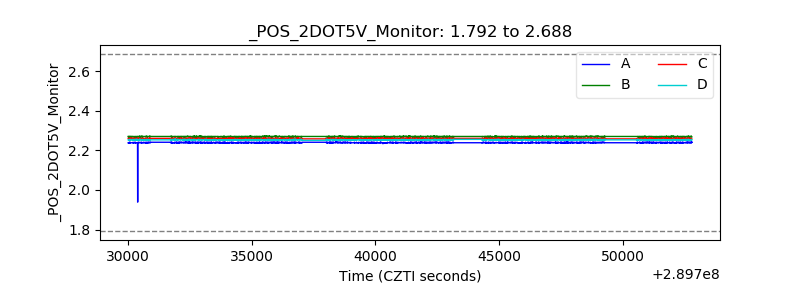 |
| +5 Volts monitor | 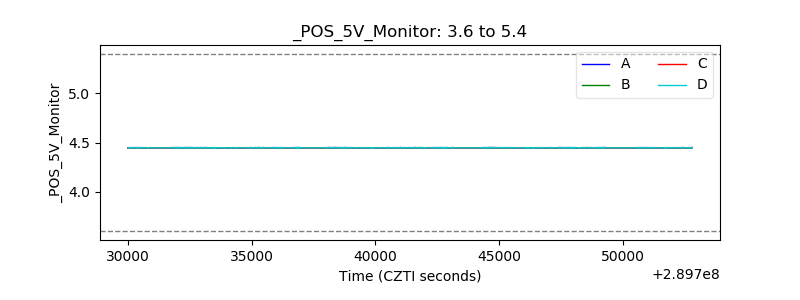 |
| _ROLL_ROT | 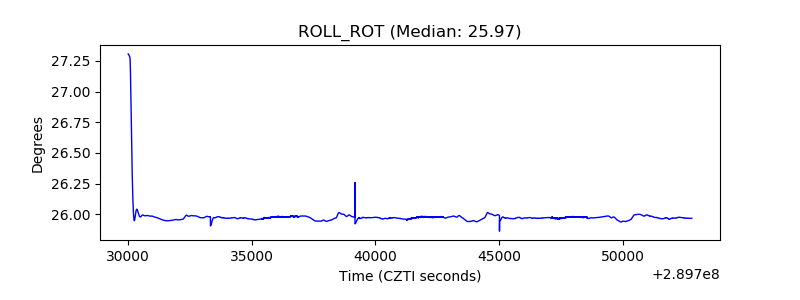 |
| _Roll_DEC |  |
| _Roll_RA |  |
| Veto Counter |  |