| Param | Original file | Final file |
|---|---|---|
| Filename | modeM0/AS1A05_104T03_9000002770cztM0_level2_bc.evt | modeM0/AS1A05_104T03_9000002770cztM0_level2_quad_clean.evt |
| Size (bytes) | 1,099,376,640 | 389,880,000 |
| Size | 1.0 GB | 371.8 MB |
| Events in quadrant A | 6,512,084 | 2,410,285 |
| Events in quadrant B | 6,623,106 | 2,472,037 |
| Events in quadrant C | 7,041,171 | 2,400,863 |
| Events in quadrant D | 10,910,357 | 2,304,633 |
| Mode M9 | |||
|---|---|---|---|
| Quadrant | BADHDUFLAG | Total packets | Discarded packets |
| A | 0 | 18 | 0 |
| B | 0 | 18 | 0 |
| C | 0 | 18 | 0 |
| D | 0 | 18 | 0 |
| Mode M0 | |||
|---|---|---|---|
| Quadrant | BADHDUFLAG | Total packets | Discarded packets |
| A | 0 | 66919 | 0 |
| B | 0 | 67445 | 0 |
| C | 0 | 69264 | 0 |
| D | 0 | 82251 | 0 |
| Mode SS | |||
|---|---|---|---|
| Quadrant | BADHDUFLAG | Total packets | Discarded packets |
| A | 0 | 656 | 0 |
| B | 0 | 656 | 0 |
| C | 0 | 656 | 0 |
| D | 0 | 656 | 0 |
| Quadrant | Total seconds | Saturated seconds | Saturation percentage |
|---|---|---|---|
| A | 32313 | 425 | 1.315260% |
| B | 32313 | 523 | 1.618544% |
| C | 32313 | 687 | 2.126079% |
| D | 32313 | 1290 | 3.992201% |
Noise dominated data is calculated using 1-second bins in cleaned event files. If a bin has >2000 counts, and if more than 50% of those come from <1% of pixels, then it is considered to be noise-dominated and hence unusable.
| Quadrant | # 1 sec bins | Bins with >0 counts | Bins with >2000 counts | High rate bins dominated by noise | Noise dominated (total time) | Noise dominated (detector-on time) | Marked lightcurve |
|---|---|---|---|---|---|---|---|
| A | 34103 | 32313 | 21 | 21 | 0.06% | 0.06% |  |
| B | 34103 | 32312 | 2 | 2 | 0.01% | 0.01% | 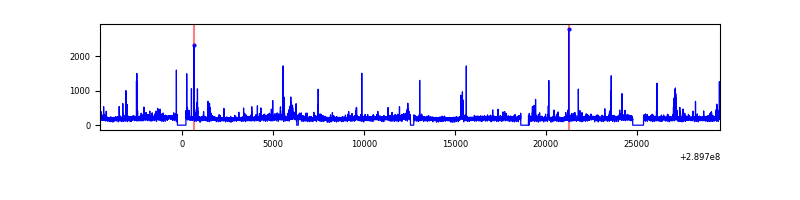 |
| C | 34103 | 32313 | 13 | 13 | 0.04% | 0.04% |  |
| D | 34103 | 32313 | 244 | 244 | 0.72% | 0.76% |  |
Top three noisy pixels from each quadrant. If the there are fewer than three noisy pixels in the level2.evt file, extra rows are filled as -1
| Pixel properties | Quadrant properties | ||||||
|---|---|---|---|---|---|---|---|
| Quadrant | DetID | PixID | Counts | Sigma | Mean | Median | Sigma |
| A | 0 | 13 | 203999 | 568.88 | 1611 | 1577 | 355.8 |
| A | 13 | 254 | 46285 | 125.65 | 1611 | 1577 | 355.8 |
| A | 9 | 143 | 45845 | 124.41 | 1611 | 1577 | 355.8 |
| B | 0 | 229 | 103205 | 325.89 | 1634 | 1588 | 311.8 |
| B | 0 | 230 | 91026 | 286.83 | 1634 | 1588 | 311.8 |
| B | 3 | 64 | 43609 | 134.76 | 1634 | 1588 | 311.8 |
| C | 3 | 233 | 880111 | 2362.04 | 1574 | 1561 | 371.9 |
| C | 9 | 54 | 76958 | 202.71 | 1574 | 1561 | 371.9 |
| C | 8 | 128 | 14660 | 35.22 | 1574 | 1561 | 371.9 |
| D | 1 | 52 | 3758387 | 10173.65 | 1581 | 1519 | 369.3 |
| D | 7 | 238 | 633256 | 1710.75 | 1581 | 1519 | 369.3 |
| D | 7 | 96 | 165788 | 444.84 | 1581 | 1519 | 369.3 |
Histogram calculated using DETX and DETY for each event in the final _common_clean file
| Quadrant A |  |
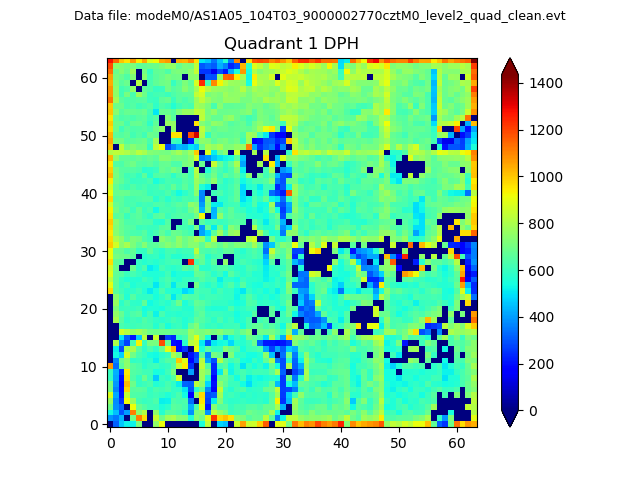 |
Quadrant B |
|---|---|---|---|
| Quadrant D |  |
 |
Quadrant C |
| Plot type | Count rate plots | Images |
|---|---|---|
| Comparison with Poisson distribution Blue bars denote a histogram of data divided into 1 sec bins. Red curve is a Poisson curve with rate = median count rate of data. |
 |
 |
| Quadrant-wise count rates Data is divided into 100 sec bins |
 |
|
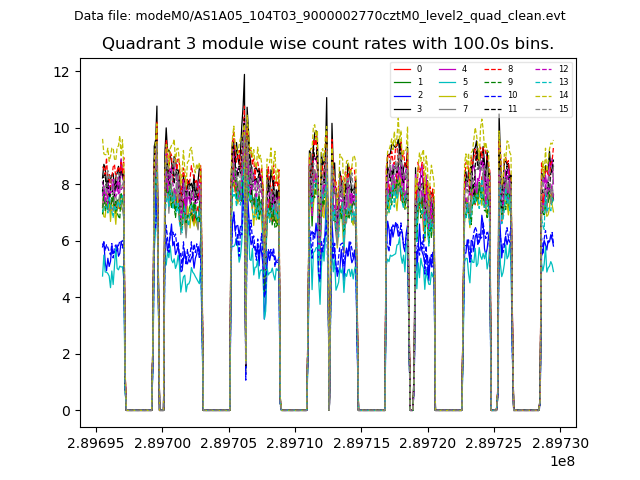
| Module-wise count rates for Quadrant A Data is divided into 100 sec bins |
 |
 |
| Module-wise count rates for Quadrant B Data is divided into 100 sec bins |
 |
 |
| Module-wise count rates for Quadrant C Data is divided into 100 sec bins |
 |
 |
| Module-wise count rates for Quadrant D Data is divided into 100 sec bins |
 |
 |
| Parameter | Plot |
|---|---|
| CZT HV Monitor | 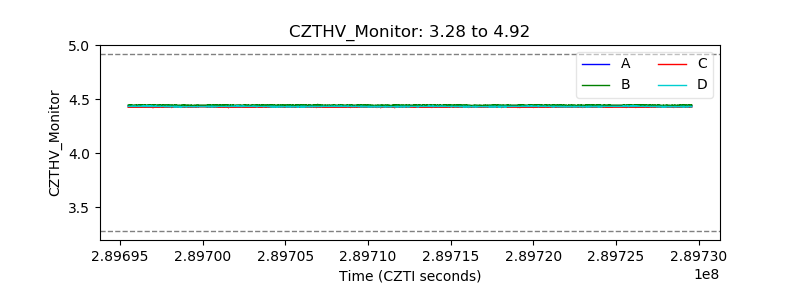 |
| D_VDD |  |
| Temperature 1 | 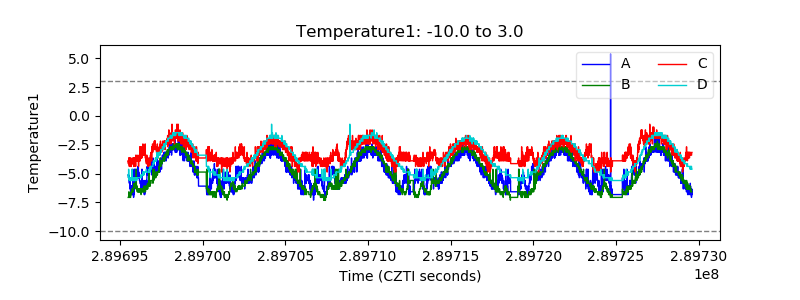 |
| Veto HV Monitor |  |
| Veto LLD |  |
| Alpha Counter |  |
| _CPM_Rate |  |
| CZT Counter | 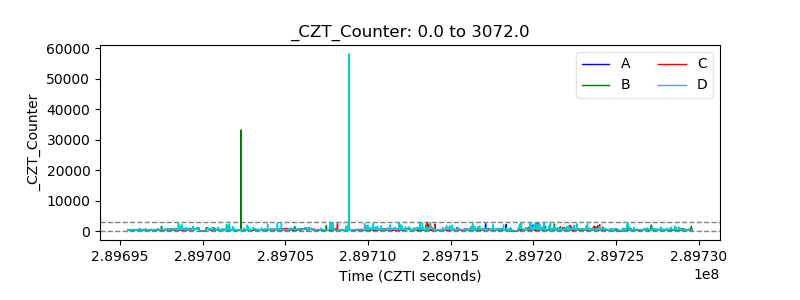 |
| +2.5 Volts monitor |  |
| +5 Volts monitor |  |
| _ROLL_ROT |  |
| _Roll_DEC | 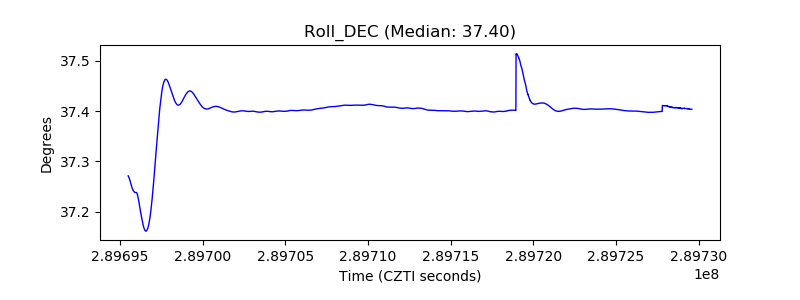 |
| _Roll_RA |  |
| Veto Counter | 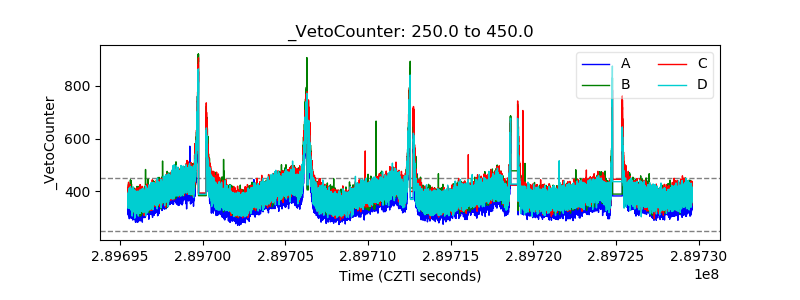 |