| Param | Original file | Final file |
|---|---|---|
| Filename | modeM0/AS1A05_075T06_9000002766cztM0_level2_bc.evt | modeM0/AS1A05_075T06_9000002766cztM0_level2_quad_clean.evt |
| Size (bytes) | 654,399,360 | 272,525,760 |
| Size | 624.1 MB | 259.9 MB |
| Events in quadrant A | 4,206,183 | 1,760,270 |
| Events in quadrant B | 4,350,214 | 1,795,067 |
| Events in quadrant C | 4,448,851 | 1,743,983 |
| Events in quadrant D | 5,574,299 | 1,708,484 |
| Mode SS | |||
|---|---|---|---|
| Quadrant | BADHDUFLAG | Total packets | Discarded packets |
| A | 0 | 370 | 0 |
| B | 0 | 370 | 0 |
| C | 0 | 370 | 0 |
| D | 0 | 370 | 0 |
| Mode M9 | |||
|---|---|---|---|
| Quadrant | BADHDUFLAG | Total packets | Discarded packets |
| A | 0 | 49 | 0 |
| B | 0 | 49 | 0 |
| C | 0 | 49 | 0 |
| D | 0 | 49 | 0 |
| Mode M0 | |||
|---|---|---|---|
| Quadrant | BADHDUFLAG | Total packets | Discarded packets |
| A | 0 | 39338 | 0 |
| B | 0 | 39796 | 0 |
| C | 0 | 40930 | 0 |
| D | 0 | 43758 | 0 |
| Quadrant | Total seconds | Saturated seconds | Saturation percentage |
|---|---|---|---|
| A | 18089 | 246 | 1.359943% |
| B | 18089 | 268 | 1.481563% |
| C | 18089 | 396 | 2.189176% |
| D | 18089 | 485 | 2.681187% |
Noise dominated data is calculated using 1-second bins in cleaned event files. If a bin has >2000 counts, and if more than 50% of those come from <1% of pixels, then it is considered to be noise-dominated and hence unusable.
| Quadrant | # 1 sec bins | Bins with >0 counts | Bins with >2000 counts | High rate bins dominated by noise | Noise dominated (total time) | Noise dominated (detector-on time) | Marked lightcurve |
|---|---|---|---|---|---|---|---|
| A | 22965 | 18085 | 2 | 2 | 0.01% | 0.01% | 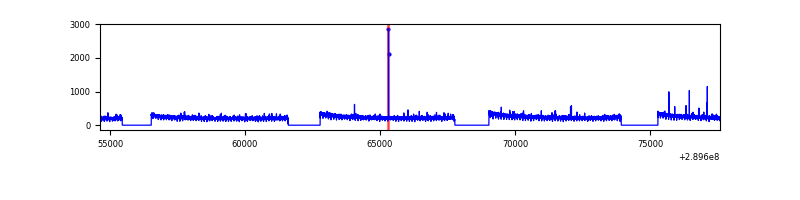 |
| B | 22965 | 18087 | 1 | 1 | 0.00% | 0.01% |  |
| C | 22965 | 18087 | 5 | 5 | 0.02% | 0.03% | 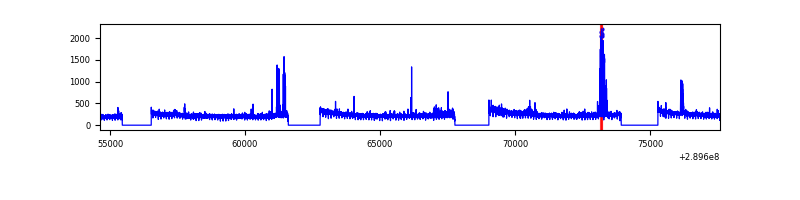 |
| D | 22965 | 18086 | 56 | 56 | 0.24% | 0.31% |  |
Top three noisy pixels from each quadrant. If the there are fewer than three noisy pixels in the level2.evt file, extra rows are filled as -1
| Pixel properties | Quadrant properties | ||||||
|---|---|---|---|---|---|---|---|
| Quadrant | DetID | PixID | Counts | Sigma | Mean | Median | Sigma |
| A | 13 | 254 | 27379 | 114.71 | 1081 | 1066 | 229.4 |
| A | 9 | 143 | 13568 | 54.5 | 1081 | 1066 | 229.4 |
| A | 15 | 192 | 9688 | 37.59 | 1081 | 1066 | 229.4 |
| B | 0 | 229 | 92548 | 451.35 | 1098 | 1074 | 202.7 |
| B | 12 | 18 | 19700 | 91.9 | 1098 | 1074 | 202.7 |
| B | 4 | 173 | 11677 | 52.32 | 1098 | 1074 | 202.7 |
| C | 9 | 54 | 178633 | 723.0 | 1060 | 1057 | 245.6 |
| C | 3 | 233 | 147899 | 597.87 | 1060 | 1057 | 245.6 |
| C | 9 | 221 | 40580 | 160.92 | 1060 | 1057 | 245.6 |
| D | 7 | 238 | 732735 | 3005.51 | 1077 | 1044 | 243.4 |
| D | 1 | 52 | 407454 | 1669.38 | 1077 | 1044 | 243.4 |
| D | 5 | 222 | 214973 | 878.74 | 1077 | 1044 | 243.4 |
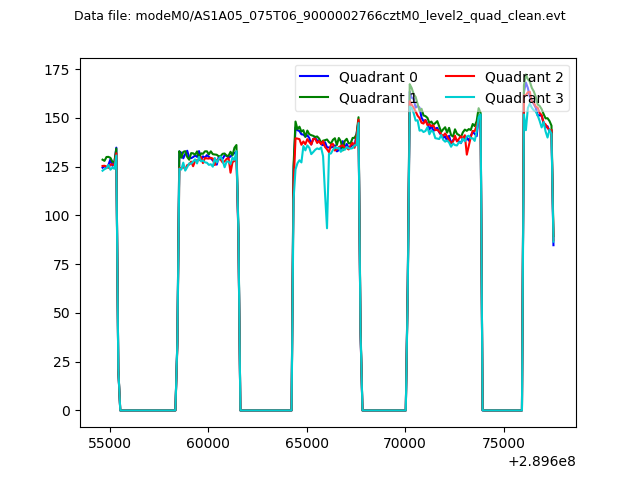
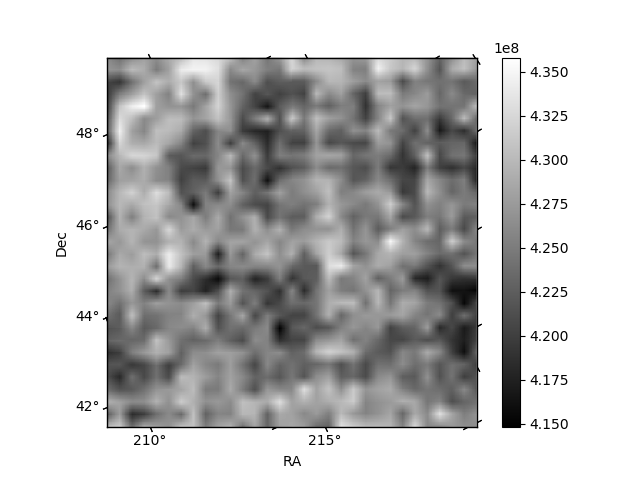
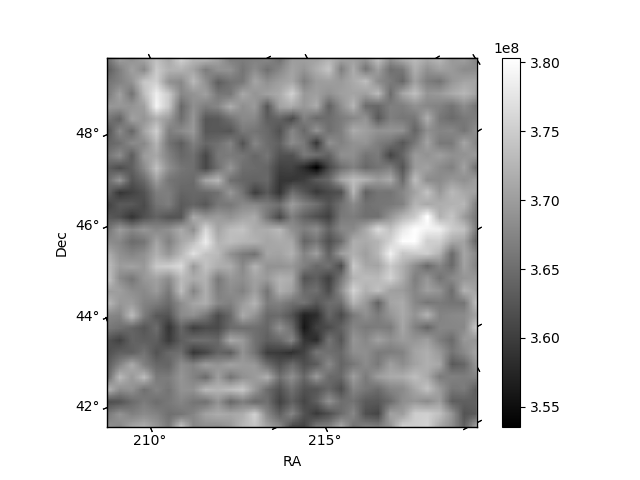
Histogram calculated using DETX and DETY for each event in the final _common_clean file
| Quadrant A |  |
 |
Quadrant B |
|---|---|---|---|
| Quadrant D |  |
 |
Quadrant C |
| Plot type | Count rate plots | Images |
|---|---|---|
| Comparison with Poisson distribution Blue bars denote a histogram of data divided into 1 sec bins. Red curve is a Poisson curve with rate = median count rate of data. |
 |
 |
| Quadrant-wise count rates Data is divided into 100 sec bins |
 |
|
| Module-wise count rates for Quadrant A Data is divided into 100 sec bins |
 |
 |
| Module-wise count rates for Quadrant B Data is divided into 100 sec bins |
 |
 |
| Module-wise count rates for Quadrant C Data is divided into 100 sec bins |
 |
 |
| Module-wise count rates for Quadrant D Data is divided into 100 sec bins |
 |
 |
| Parameter | Plot |
|---|---|
| CZT HV Monitor | 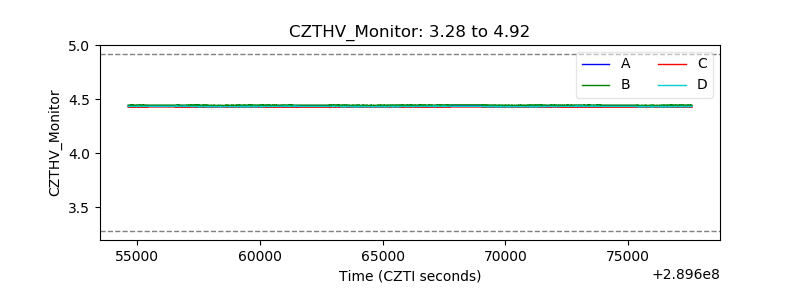 |
| D_VDD | 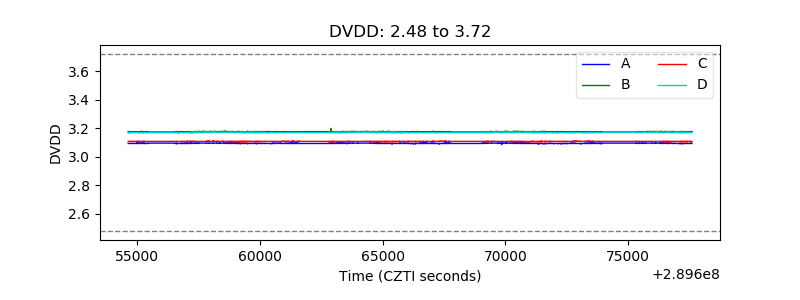 |
| Temperature 1 |  |
| Veto HV Monitor |  |
| Veto LLD |  |
| Alpha Counter |  |
| _CPM_Rate | 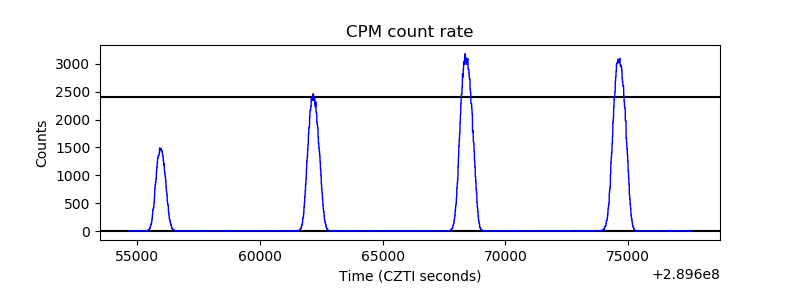 |
| CZT Counter | 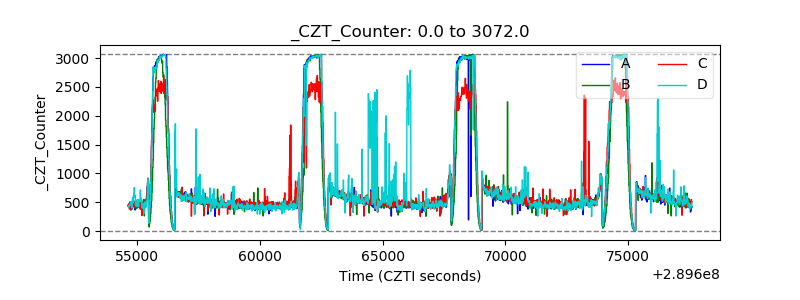 |
| +2.5 Volts monitor | 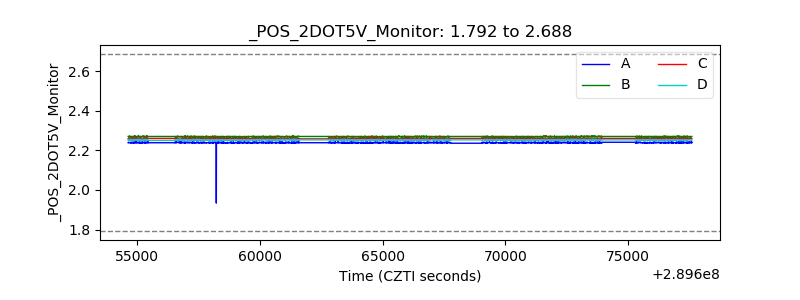 |
| +5 Volts monitor |  |
| _ROLL_ROT |  |
| _Roll_DEC |  |
| _Roll_RA |  |
| Veto Counter | 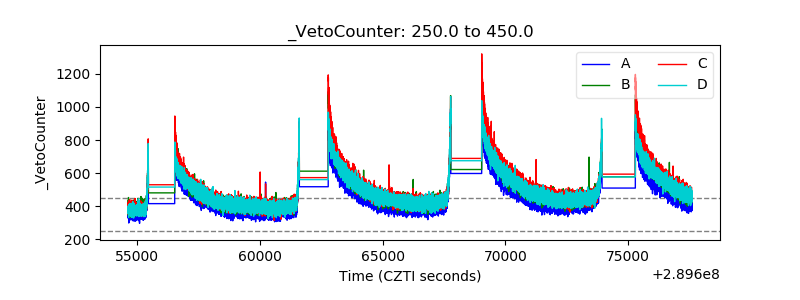 |