| Param | Original file | Final file |
|---|---|---|
| Filename | modeM0/AS1A05_075T05_9000002764cztM0_level2_bc.evt | modeM0/AS1A05_075T05_9000002764cztM0_level2_quad_clean.evt |
| Size (bytes) | 927,089,280 | 305,510,400 |
| Size | 884.1 MB | 291.4 MB |
| Events in quadrant A | 5,725,681 | 1,895,484 |
| Events in quadrant B | 5,166,418 | 1,945,688 |
| Events in quadrant C | 6,922,367 | 1,793,810 |
| Events in quadrant D | 8,496,437 | 1,841,636 |
| Mode M9 | |||
|---|---|---|---|
| Quadrant | BADHDUFLAG | Total packets | Discarded packets |
| A | 0 | 20 | 0 |
| B | 0 | 20 | 0 |
| C | 0 | 20 | 0 |
| D | 0 | 20 | 0 |
| Mode M0 | |||
|---|---|---|---|
| Quadrant | BADHDUFLAG | Total packets | Discarded packets |
| A | 0 | 54981 | 0 |
| B | 0 | 52734 | 0 |
| C | 0 | 64690 | 0 |
| D | 0 | 63224 | 0 |
| Mode SS | |||
|---|---|---|---|
| Quadrant | BADHDUFLAG | Total packets | Discarded packets |
| A | 0 | 524 | 0 |
| B | 0 | 524 | 0 |
| C | 0 | 524 | 0 |
| D | 0 | 524 | 0 |
| Quadrant | Total seconds | Saturated seconds | Saturation percentage |
|---|---|---|---|
| A | 25820 | 412 | 1.595662% |
| B | 25820 | 174 | 0.673896% |
| C | 25820 | 2004 | 7.761425% |
| D | 25820 | 582 | 2.254067% |
Noise dominated data is calculated using 1-second bins in cleaned event files. If a bin has >2000 counts, and if more than 50% of those come from <1% of pixels, then it is considered to be noise-dominated and hence unusable.
| Quadrant | # 1 sec bins | Bins with >0 counts | Bins with >2000 counts | High rate bins dominated by noise | Noise dominated (total time) | Noise dominated (detector-on time) | Marked lightcurve |
|---|---|---|---|---|---|---|---|
| A | 29328 | 25819 | 88 | 88 | 0.30% | 0.34% |  |
| B | 29328 | 25819 | 0 | 0 | 0.00% | 0.00% |  |
| C | 29329 | 25820 | 29 | 29 | 0.10% | 0.11% |  |
| D | 29328 | 25819 | 68 | 68 | 0.23% | 0.26% | 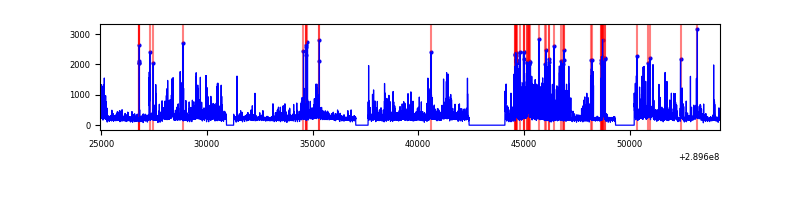 |
Top three noisy pixels from each quadrant. If the there are fewer than three noisy pixels in the level2.evt file, extra rows are filled as -1
| Pixel properties | Quadrant properties | ||||||
|---|---|---|---|---|---|---|---|
| Quadrant | DetID | PixID | Counts | Sigma | Mean | Median | Sigma |
| A | 0 | 13 | 775959 | 2759.08 | 1269 | 1242 | 280.8 |
| A | 13 | 254 | 38907 | 134.14 | 1269 | 1242 | 280.8 |
| A | 9 | 143 | 14245 | 46.31 | 1269 | 1242 | 280.8 |
| B | 0 | 229 | 65887 | 260.52 | 1291 | 1257 | 248.1 |
| B | 4 | 216 | 38090 | 148.47 | 1291 | 1257 | 248.1 |
| B | 0 | 190 | 28655 | 110.44 | 1291 | 1257 | 248.1 |
| C | 4 | 254 | 1876125 | 6678.23 | 1185 | 1174 | 280.8 |
| C | 3 | 233 | 441375 | 1567.92 | 1185 | 1174 | 280.8 |
| C | 9 | 54 | 19770 | 66.24 | 1185 | 1174 | 280.8 |
| D | 1 | 52 | 1329698 | 4540.49 | 1255 | 1209 | 292.6 |
| D | 7 | 238 | 992625 | 3388.45 | 1255 | 1209 | 292.6 |
| D | 5 | 222 | 892054 | 3044.72 | 1255 | 1209 | 292.6 |
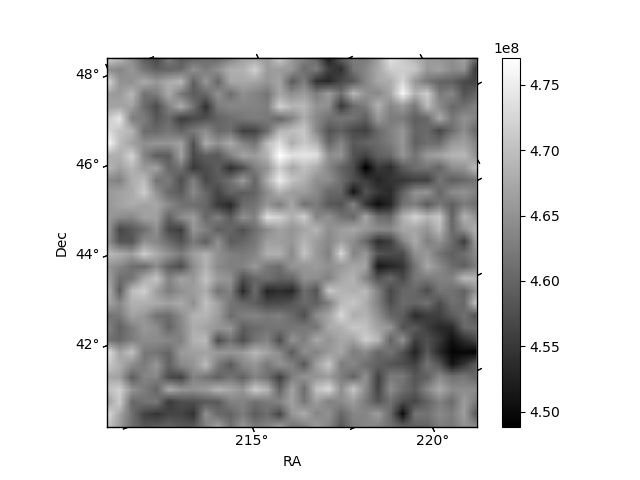
Histogram calculated using DETX and DETY for each event in the final _common_clean file
| Quadrant A | 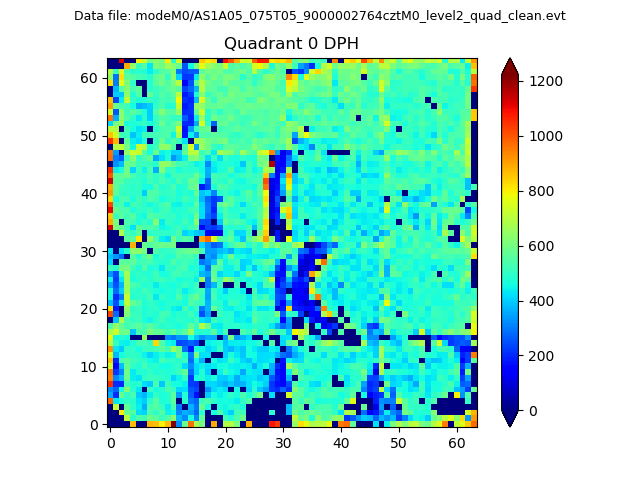 |
 |
Quadrant B |
|---|---|---|---|
| Quadrant D |  |
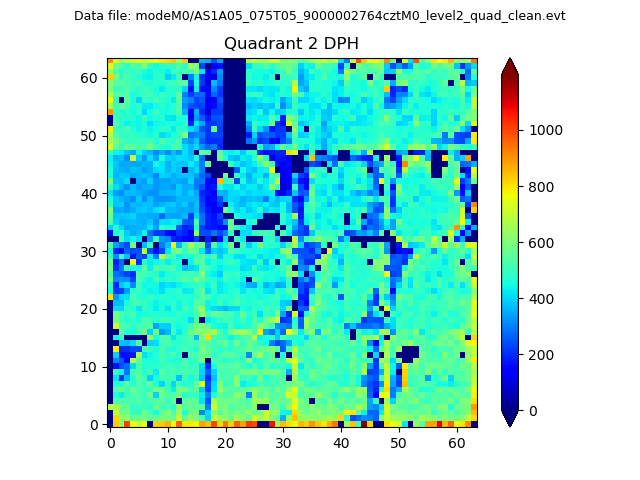 |
Quadrant C |
| Plot type | Count rate plots | Images |
|---|---|---|
| Comparison with Poisson distribution Blue bars denote a histogram of data divided into 1 sec bins. Red curve is a Poisson curve with rate = median count rate of data. |
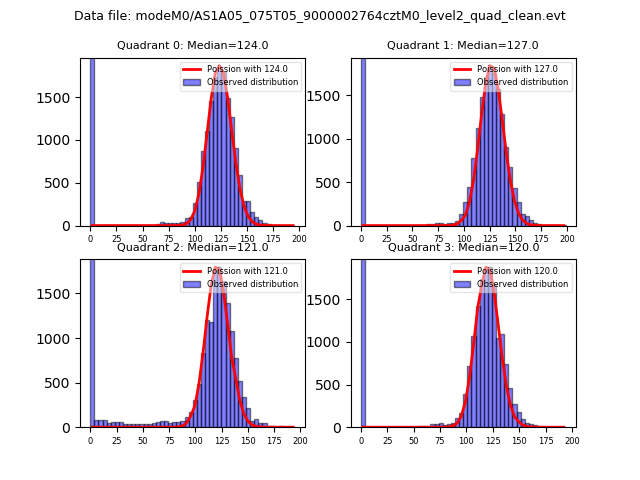 |
 |
| Quadrant-wise count rates Data is divided into 100 sec bins |
 |
|
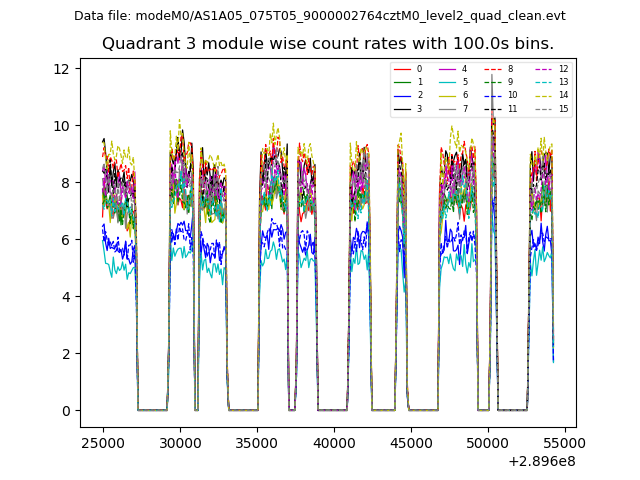
| Module-wise count rates for Quadrant A Data is divided into 100 sec bins |
 |
 |
| Module-wise count rates for Quadrant B Data is divided into 100 sec bins |
 |
 |
| Module-wise count rates for Quadrant C Data is divided into 100 sec bins |
 |
 |
| Module-wise count rates for Quadrant D Data is divided into 100 sec bins |
 |
 |
| Parameter | Plot |
|---|---|
| CZT HV Monitor |  |
| D_VDD |  |
| Temperature 1 | 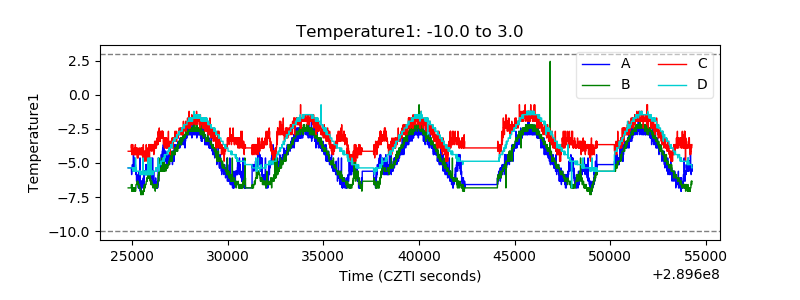 |
| Veto HV Monitor |  |
| Veto LLD |  |
| Alpha Counter | 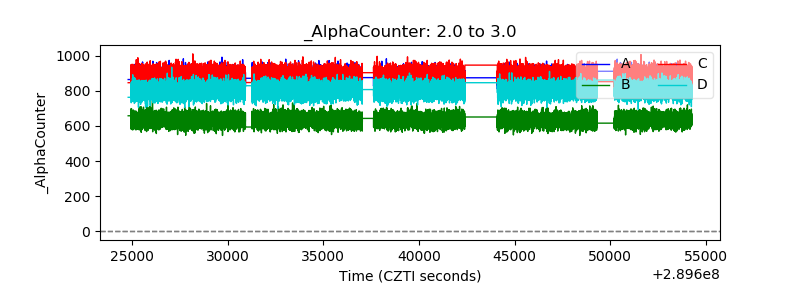 |
| _CPM_Rate |  |
| CZT Counter |  |
| +2.5 Volts monitor |  |
| +5 Volts monitor |  |
| _ROLL_ROT | 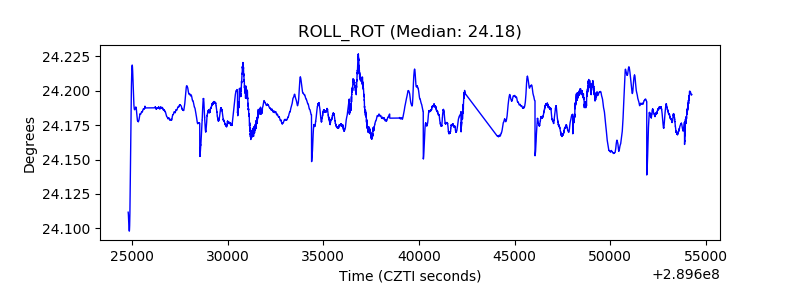 |
| _Roll_DEC |  |
| _Roll_RA |  |
| Veto Counter |  |