| Param | Original file | Final file |
|---|---|---|
| Filename | modeM0/AS1A05_072T02_9000002762cztM0_level2_bc.evt | modeM0/AS1A05_072T02_9000002762cztM0_level2_quad_clean.evt |
| Size (bytes) | 1,619,400,960 | 610,997,760 |
| Size | 1.5 GB | 582.7 MB |
| Events in quadrant A | 9,787,127 | 3,868,154 |
| Events in quadrant B | 9,903,894 | 4,002,418 |
| Events in quadrant C | 11,013,201 | 3,856,441 |
| Events in quadrant D | 15,303,741 | 3,725,554 |
| Mode SS | |||
|---|---|---|---|
| Quadrant | BADHDUFLAG | Total packets | Discarded packets |
| A | 0 | 906 | 0 |
| B | 0 | 906 | 0 |
| C | 0 | 906 | 0 |
| D | 0 | 906 | 0 |
| Mode M9 | |||
|---|---|---|---|
| Quadrant | BADHDUFLAG | Total packets | Discarded packets |
| A | 0 | 97 | 0 |
| B | 0 | 97 | 0 |
| C | 0 | 97 | 0 |
| D | 0 | 97 | 0 |
| Mode M0 | |||
|---|---|---|---|
| Quadrant | BADHDUFLAG | Total packets | Discarded packets |
| A | 0 | 94750 | 0 |
| B | 0 | 95250 | 0 |
| C | 0 | 101852 | 0 |
| D | 0 | 114746 | 0 |
| Quadrant | Total seconds | Saturated seconds | Saturation percentage |
|---|---|---|---|
| A | 44504 | 407 | 0.914525% |
| B | 44505 | 477 | 1.071790% |
| C | 44505 | 1305 | 2.932255% |
| D | 44505 | 1777 | 3.992810% |
Noise dominated data is calculated using 1-second bins in cleaned event files. If a bin has >2000 counts, and if more than 50% of those come from <1% of pixels, then it is considered to be noise-dominated and hence unusable.
| Quadrant | # 1 sec bins | Bins with >0 counts | Bins with >2000 counts | High rate bins dominated by noise | Noise dominated (total time) | Noise dominated (detector-on time) | Marked lightcurve |
|---|---|---|---|---|---|---|---|
| A | 57498 | 44505 | 6 | 6 | 0.01% | 0.01% |  |
| B | 57498 | 44503 | 3 | 3 | 0.01% | 0.01% |  |
| C | 57498 | 44502 | 30 | 30 | 0.05% | 0.07% |  |
| D | 57498 | 44503 | 268 | 268 | 0.47% | 0.60% |  |
Top three noisy pixels from each quadrant. If the there are fewer than three noisy pixels in the level2.evt file, extra rows are filled as -1
| Pixel properties | Quadrant properties | ||||||
|---|---|---|---|---|---|---|---|
| Quadrant | DetID | PixID | Counts | Sigma | Mean | Median | Sigma |
| A | 4 | 2 | 84780 | 156.41 | 2464 | 2421 | 526.6 |
| A | 13 | 254 | 68321 | 125.15 | 2464 | 2421 | 526.6 |
| A | 9 | 143 | 62765 | 114.6 | 2464 | 2421 | 526.6 |
| B | 0 | 230 | 58838 | 121.06 | 2523 | 2463 | 465.7 |
| B | 0 | 198 | 56860 | 116.81 | 2523 | 2463 | 465.7 |
| B | 0 | 190 | 51695 | 105.72 | 2523 | 2463 | 465.7 |
| C | 4 | 254 | 1525899 | 2702.48 | 2432 | 2429 | 563.7 |
| C | 9 | 54 | 122162 | 212.39 | 2432 | 2429 | 563.7 |
| C | 3 | 233 | 14763 | 21.88 | 2432 | 2429 | 563.7 |
| D | 1 | 52 | 3491065 | 6305.35 | 2439 | 2360 | 553.3 |
| D | 7 | 238 | 1898833 | 3427.61 | 2439 | 2360 | 553.3 |
| D | 5 | 222 | 307456 | 551.42 | 2439 | 2360 | 553.3 |
Histogram calculated using DETX and DETY for each event in the final _common_clean file
| Quadrant A | 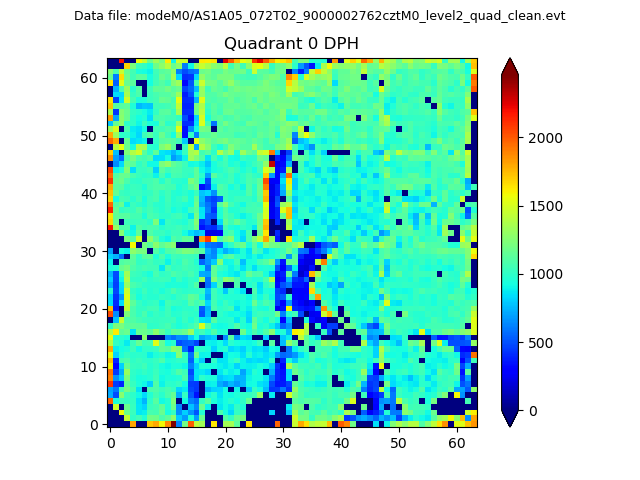 |
 |
Quadrant B |
|---|---|---|---|
| Quadrant D |  |
 |
Quadrant C |
| Plot type | Count rate plots | Images |
|---|---|---|
| Comparison with Poisson distribution Blue bars denote a histogram of data divided into 1 sec bins. Red curve is a Poisson curve with rate = median count rate of data. |
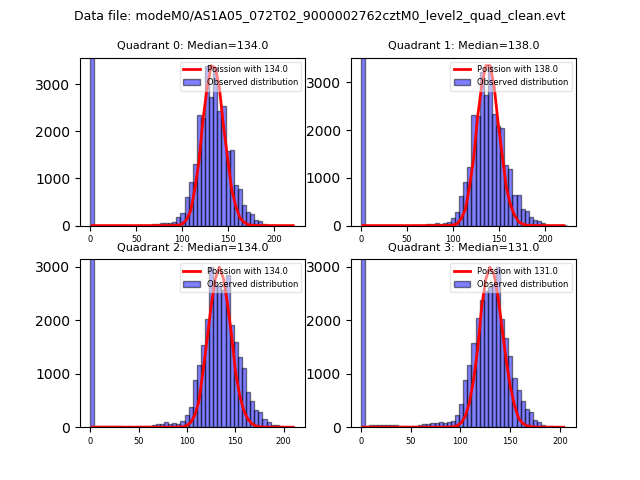 |
 |
| Quadrant-wise count rates Data is divided into 100 sec bins |
 |
|
| Module-wise count rates for Quadrant A Data is divided into 100 sec bins |
 |
 |
| Module-wise count rates for Quadrant B Data is divided into 100 sec bins |
 |
 |
| Module-wise count rates for Quadrant C Data is divided into 100 sec bins |
 |
 |
| Module-wise count rates for Quadrant D Data is divided into 100 sec bins |
 |
 |
| Parameter | Plot |
|---|---|
| CZT HV Monitor | 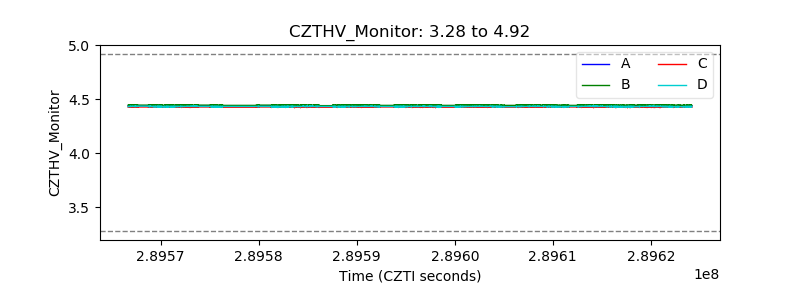 |
| D_VDD |  |
| Temperature 1 |  |
| Veto HV Monitor |  |
| Veto LLD |  |
| Alpha Counter | 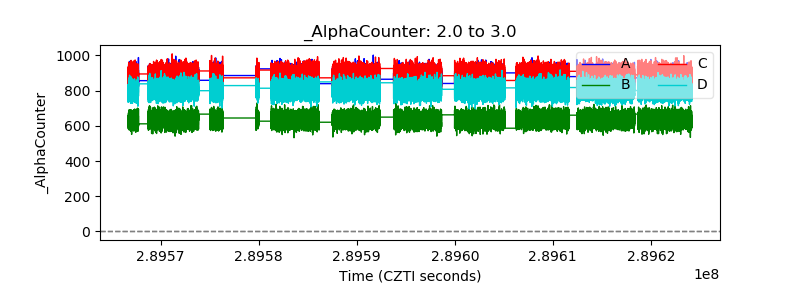 |
| _CPM_Rate |  |
| CZT Counter |  |
| +2.5 Volts monitor |  |
| +5 Volts monitor |  |
| _ROLL_ROT |  |
| _Roll_DEC | 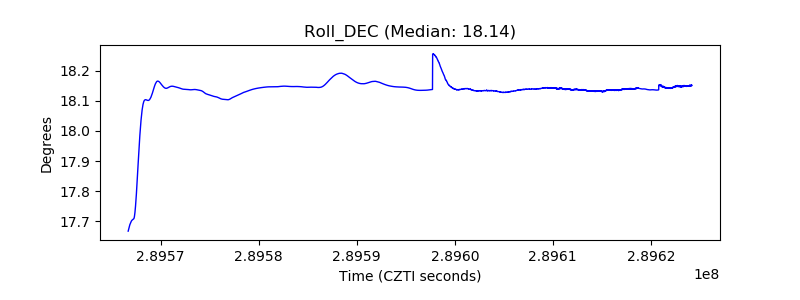 |
| _Roll_RA | 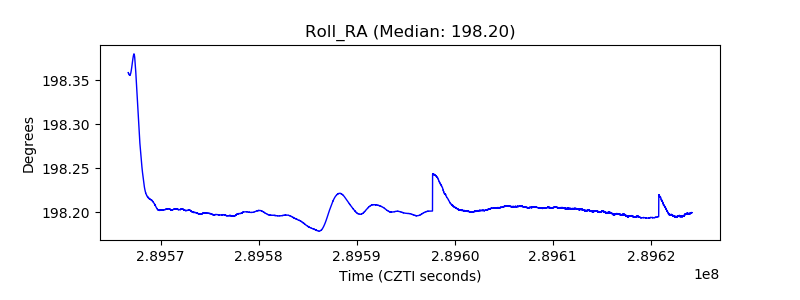 |
| Veto Counter |  |