| Param | Original file | Final file |
|---|---|---|
| Filename | modeM0/AS1A05_167T01_9000002758cztM0_level2_bc.evt | modeM0/AS1A05_167T01_9000002758cztM0_level2_quad_clean.evt |
| Size (bytes) | 1,708,473,600 | 587,237,760 |
| Size | 1.6 GB | 560.0 MB |
| Events in quadrant A | 9,684,286 | 3,734,902 |
| Events in quadrant B | 9,832,676 | 3,851,757 |
| Events in quadrant C | 9,814,898 | 3,735,792 |
| Events in quadrant D | 19,502,275 | 3,537,763 |
| Mode SS | |||
|---|---|---|---|
| Quadrant | BADHDUFLAG | Total packets | Discarded packets |
| A | 0 | 874 | 0 |
| B | 0 | 874 | 0 |
| C | 0 | 874 | 0 |
| D | 0 | 874 | 0 |
| Mode M0 | |||
|---|---|---|---|
| Quadrant | BADHDUFLAG | Total packets | Discarded packets |
| A | 0 | 91856 | 0 |
| B | 0 | 92444 | 0 |
| C | 0 | 93423 | 0 |
| D | 0 | 127079 | 0 |
| Mode M9 | |||
|---|---|---|---|
| Quadrant | BADHDUFLAG | Total packets | Discarded packets |
| A | 0 | 96 | 0 |
| B | 0 | 96 | 0 |
| C | 0 | 96 | 0 |
| D | 0 | 96 | 0 |
| Quadrant | Total seconds | Saturated seconds | Saturation percentage |
|---|---|---|---|
| A | 42621 | 655 | 1.536801% |
| B | 42621 | 666 | 1.562610% |
| C | 42621 | 773 | 1.813660% |
| D | 42621 | 3021 | 7.088055% |
Noise dominated data is calculated using 1-second bins in cleaned event files. If a bin has >2000 counts, and if more than 50% of those come from <1% of pixels, then it is considered to be noise-dominated and hence unusable.
| Quadrant | # 1 sec bins | Bins with >0 counts | Bins with >2000 counts | High rate bins dominated by noise | Noise dominated (total time) | Noise dominated (detector-on time) | Marked lightcurve |
|---|---|---|---|---|---|---|---|
| A | 52362 | 42618 | 34 | 34 | 0.06% | 0.08% |  |
| B | 52362 | 42618 | 6 | 6 | 0.01% | 0.01% |  |
| C | 52362 | 42614 | 9 | 9 | 0.02% | 0.02% |  |
| D | 52362 | 42616 | 439 | 439 | 0.84% | 1.03% |  |
Top three noisy pixels from each quadrant. If the there are fewer than three noisy pixels in the level2.evt file, extra rows are filled as -1
| Pixel properties | Quadrant properties | ||||||
|---|---|---|---|---|---|---|---|
| Quadrant | DetID | PixID | Counts | Sigma | Mean | Median | Sigma |
| A | 14 | 111 | 321697 | 619.51 | 2383 | 2339 | 515.5 |
| A | 13 | 254 | 70340 | 131.91 | 2383 | 2339 | 515.5 |
| A | 4 | 2 | 57915 | 107.81 | 2383 | 2339 | 515.5 |
| B | 0 | 229 | 127479 | 277.27 | 2425 | 2363 | 451.2 |
| B | 0 | 190 | 123963 | 269.48 | 2425 | 2363 | 451.2 |
| B | 7 | 220 | 122812 | 266.93 | 2425 | 2363 | 451.2 |
| C | 4 | 254 | 495970 | 910.08 | 2344 | 2338 | 542.4 |
| C | 9 | 54 | 243772 | 445.12 | 2344 | 2338 | 542.4 |
| C | 3 | 233 | 28889 | 48.95 | 2344 | 2338 | 542.4 |
| D | 7 | 238 | 5210478 | 9893.19 | 2320 | 2245 | 526.4 |
| D | 1 | 52 | 4822336 | 9155.9 | 2320 | 2245 | 526.4 |
| D | 14 | 34 | 176159 | 330.35 | 2320 | 2245 | 526.4 |
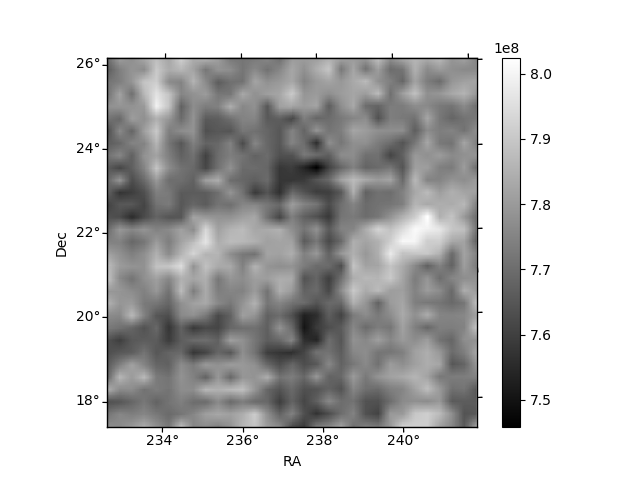
Histogram calculated using DETX and DETY for each event in the final _common_clean file
| Quadrant A |  |
 |
Quadrant B |
|---|---|---|---|
| Quadrant D |  |
 |
Quadrant C |
| Plot type | Count rate plots | Images |
|---|---|---|
| Comparison with Poisson distribution Blue bars denote a histogram of data divided into 1 sec bins. Red curve is a Poisson curve with rate = median count rate of data. |
 |
 |
| Quadrant-wise count rates Data is divided into 100 sec bins |
 |
|
| Module-wise count rates for Quadrant A Data is divided into 100 sec bins |
 |
 |
| Module-wise count rates for Quadrant B Data is divided into 100 sec bins |
 |
 |
| Module-wise count rates for Quadrant C Data is divided into 100 sec bins |
 |
 |
| Module-wise count rates for Quadrant D Data is divided into 100 sec bins |
 |
 |
| Parameter | Plot |
|---|---|
| CZT HV Monitor |  |
| D_VDD |  |
| Temperature 1 |  |
| Veto HV Monitor | 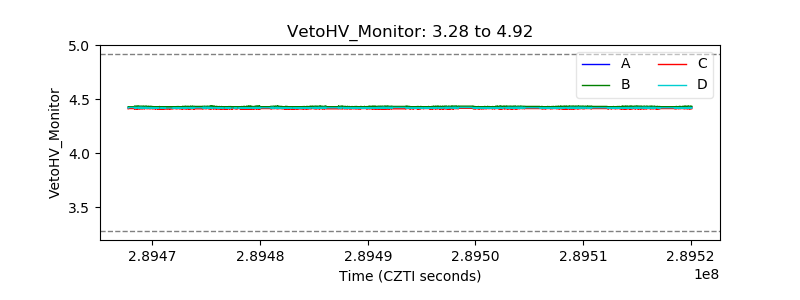 |
| Veto LLD | 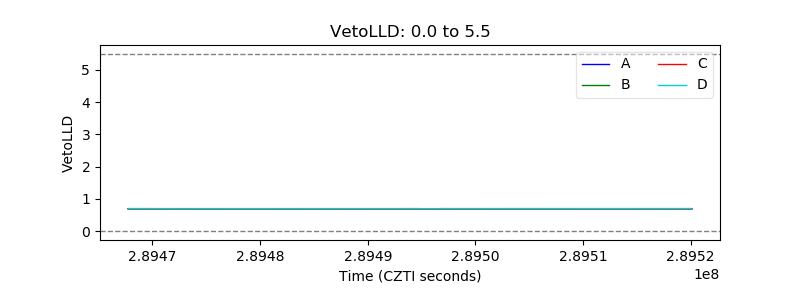 |
| Alpha Counter |  |
| _CPM_Rate | 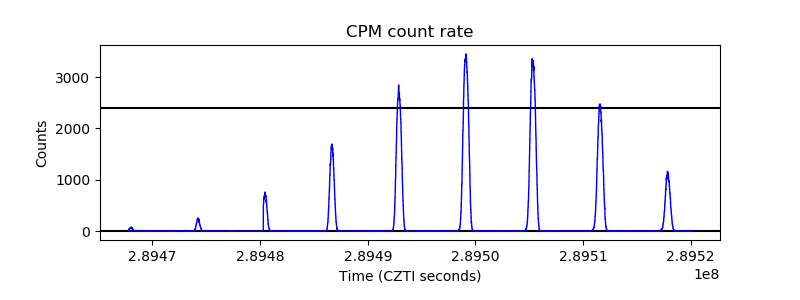 |
| CZT Counter |  |
| +2.5 Volts monitor |  |
| +5 Volts monitor |  |
| _ROLL_ROT |  |
| _Roll_DEC | 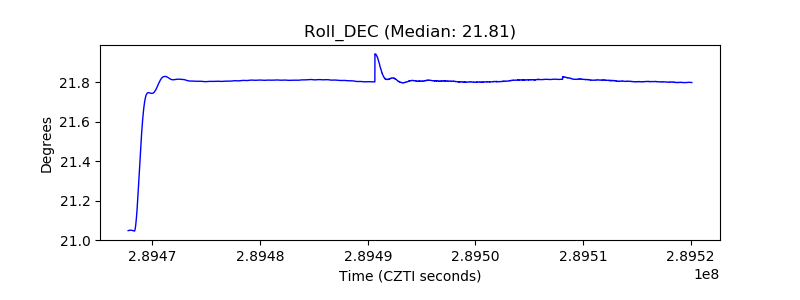 |
| _Roll_RA |  |
| Veto Counter |  |