| Param | Original file | Final file |
|---|---|---|
| Filename | modeM0/AS1A05_075T07_9000002760cztM0_level2_bc.evt | modeM0/AS1A05_075T07_9000002760cztM0_level2_quad_clean.evt |
| Size (bytes) | 1,584,555,840 | 505,442,880 |
| Size | 1.5 GB | 482.0 MB |
| Events in quadrant A | 8,798,235 | 3,124,729 |
| Events in quadrant B | 8,493,494 | 3,220,682 |
| Events in quadrant C | 9,933,178 | 3,100,558 |
| Events in quadrant D | 17,884,704 | 2,966,553 |
| Mode M9 | |||
|---|---|---|---|
| Quadrant | BADHDUFLAG | Total packets | Discarded packets |
| A | 0 | 36 | 0 |
| B | 0 | 36 | 0 |
| C | 0 | 36 | 0 |
| D | 0 | 36 | 0 |
| Mode M0 | |||
|---|---|---|---|
| Quadrant | BADHDUFLAG | Total packets | Discarded packets |
| A | 0 | 89200 | 0 |
| B | 0 | 87235 | 0 |
| C | 0 | 94844 | 0 |
| D | 0 | 121338 | 0 |
| Mode SS | |||
|---|---|---|---|
| Quadrant | BADHDUFLAG | Total packets | Discarded packets |
| A | 0 | 856 | 0 |
| B | 0 | 856 | 0 |
| C | 0 | 856 | 0 |
| D | 0 | 856 | 0 |
| Quadrant | Total seconds | Saturated seconds | Saturation percentage |
|---|---|---|---|
| A | 42177 | 789 | 1.870688% |
| B | 42177 | 662 | 1.569576% |
| C | 42177 | 1403 | 3.326458% |
| D | 42177 | 3568 | 8.459587% |
Noise dominated data is calculated using 1-second bins in cleaned event files. If a bin has >2000 counts, and if more than 50% of those come from <1% of pixels, then it is considered to be noise-dominated and hence unusable.
| Quadrant | # 1 sec bins | Bins with >0 counts | Bins with >2000 counts | High rate bins dominated by noise | Noise dominated (total time) | Noise dominated (detector-on time) | Marked lightcurve |
|---|---|---|---|---|---|---|---|
| A | 45632 | 42176 | 14 | 14 | 0.03% | 0.03% |  |
| B | 45632 | 42176 | 4 | 4 | 0.01% | 0.01% |  |
| C | 45632 | 42176 | 42 | 42 | 0.09% | 0.10% |  |
| D | 45632 | 42176 | 533 | 533 | 1.17% | 1.26% |  |
Top three noisy pixels from each quadrant. If the there are fewer than three noisy pixels in the level2.evt file, extra rows are filled as -1
| Pixel properties | Quadrant properties | ||||||
|---|---|---|---|---|---|---|---|
| Quadrant | DetID | PixID | Counts | Sigma | Mean | Median | Sigma |
| A | 0 | 13 | 411415 | 877.4 | 2112 | 2068 | 466.5 |
| A | 14 | 111 | 192825 | 408.87 | 2112 | 2068 | 466.5 |
| A | 13 | 254 | 63487 | 131.65 | 2112 | 2068 | 466.5 |
| B | 0 | 190 | 72550 | 171.02 | 2153 | 2094 | 412.0 |
| B | 0 | 198 | 42846 | 98.92 | 2153 | 2094 | 412.0 |
| B | 0 | 229 | 26075 | 58.21 | 2153 | 2094 | 412.0 |
| C | 9 | 54 | 1502777 | 3084.01 | 2059 | 2041 | 486.6 |
| C | 4 | 254 | 467506 | 956.53 | 2059 | 2041 | 486.6 |
| C | 3 | 233 | 32405 | 62.4 | 2059 | 2041 | 486.6 |
| D | 1 | 52 | 5224139 | 11050.76 | 2038 | 1966 | 472.6 |
| D | 7 | 238 | 4228036 | 8942.89 | 2038 | 1966 | 472.6 |
| D | 10 | 50 | 305414 | 642.13 | 2038 | 1966 | 472.6 |
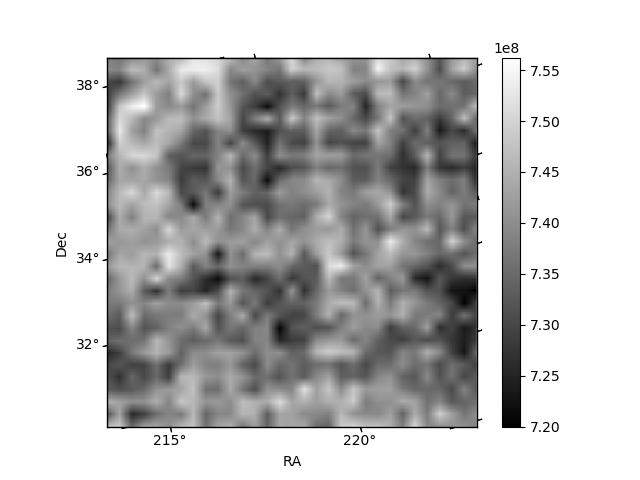
Histogram calculated using DETX and DETY for each event in the final _common_clean file
| Quadrant A |  |
 |
Quadrant B |
|---|---|---|---|
| Quadrant D |  |
 |
Quadrant C |
| Plot type | Count rate plots | Images |
|---|---|---|
| Comparison with Poisson distribution Blue bars denote a histogram of data divided into 1 sec bins. Red curve is a Poisson curve with rate = median count rate of data. |
 |
 |
| Quadrant-wise count rates Data is divided into 100 sec bins |
 |
|
| Module-wise count rates for Quadrant A Data is divided into 100 sec bins |
 |
 |
| Module-wise count rates for Quadrant B Data is divided into 100 sec bins |
 |
 |
| Module-wise count rates for Quadrant C Data is divided into 100 sec bins |
 |
 |
| Module-wise count rates for Quadrant D Data is divided into 100 sec bins |
 |
 |
| Parameter | Plot |
|---|---|
| CZT HV Monitor |  |
| D_VDD |  |
| Temperature 1 | 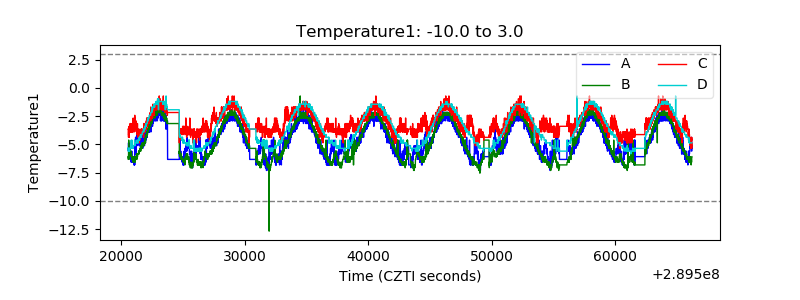 |
| Veto HV Monitor | 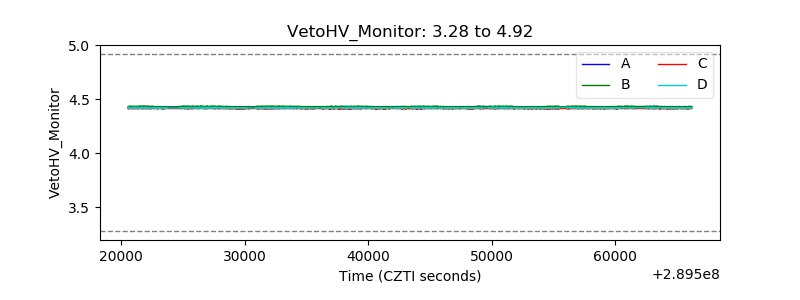 |
| Veto LLD |  |
| Alpha Counter |  |
| _CPM_Rate |  |
| CZT Counter | 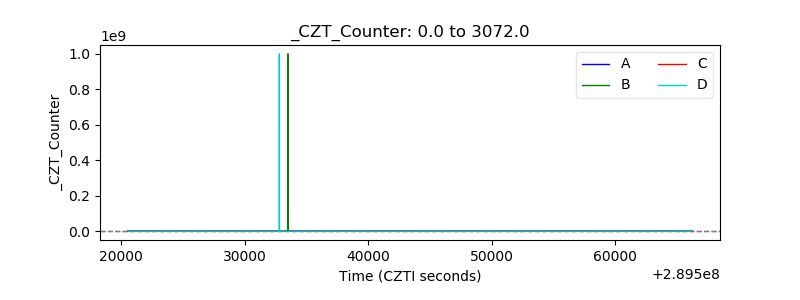 |
| +2.5 Volts monitor |  |
| +5 Volts monitor |  |
| _ROLL_ROT |  |
| _Roll_DEC |  |
| _Roll_RA |  |
| Veto Counter |  |