| Param | Original file | Final file |
|---|---|---|
| Filename | modeM0/AS1A05_104T02_9000002752cztM0_level2_bc.evt | modeM0/AS1A05_104T02_9000002752cztM0_level2_quad_clean.evt |
| Size (bytes) | 661,331,520 | 219,669,120 |
| Size | 630.7 MB | 209.5 MB |
| Events in quadrant A | 4,699,844 | 1,450,199 |
| Events in quadrant B | 3,494,961 | 1,490,772 |
| Events in quadrant C | 2,997,297 | 1,413,347 |
| Events in quadrant D | 7,854,410 | 1,309,879 |
| Mode M9 | |||
|---|---|---|---|
| Quadrant | BADHDUFLAG | Total packets | Discarded packets |
| A | 0 | 35 | 0 |
| B | 0 | 35 | 0 |
| C | 0 | 35 | 0 |
| D | 0 | 35 | 0 |
| Mode M0 | |||
|---|---|---|---|
| Quadrant | BADHDUFLAG | Total packets | Discarded packets |
| A | 0 | 37116 | 0 |
| B | 0 | 31720 | 0 |
| C | 0 | 30324 | 0 |
| D | 0 | 48405 | 0 |
| Mode SS | |||
|---|---|---|---|
| Quadrant | BADHDUFLAG | Total packets | Discarded packets |
| A | 0 | 292 | 0 |
| B | 0 | 292 | 0 |
| C | 0 | 292 | 0 |
| D | 0 | 292 | 0 |
| Quadrant | Total seconds | Saturated seconds | Saturation percentage |
|---|---|---|---|
| A | 14324 | 873 | 6.094666% |
| B | 14324 | 262 | 1.829098% |
| C | 14324 | 244 | 1.703435% |
| D | 14324 | 1517 | 10.590617% |
Noise dominated data is calculated using 1-second bins in cleaned event files. If a bin has >2000 counts, and if more than 50% of those come from <1% of pixels, then it is considered to be noise-dominated and hence unusable.
| Quadrant | # 1 sec bins | Bins with >0 counts | Bins with >2000 counts | High rate bins dominated by noise | Noise dominated (total time) | Noise dominated (detector-on time) | Marked lightcurve |
|---|---|---|---|---|---|---|---|
| A | 17764 | 14321 | 104 | 104 | 0.59% | 0.73% | 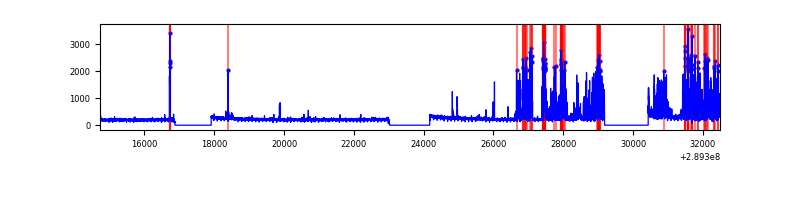 |
| B | 17764 | 14322 | 2 | 2 | 0.01% | 0.01% |  |
| C | 17764 | 14321 | 1 | 1 | 0.01% | 0.01% |  |
| D | 17764 | 14321 | 154 | 154 | 0.87% | 1.08% |  |
Top three noisy pixels from each quadrant. If the there are fewer than three noisy pixels in the level2.evt file, extra rows are filled as -1
| Pixel properties | Quadrant properties | ||||||
|---|---|---|---|---|---|---|---|
| Quadrant | DetID | PixID | Counts | Sigma | Mean | Median | Sigma |
| A | 0 | 13 | 1638790 | 9525.17 | 790 | 774 | 172.0 |
| A | 13 | 254 | 21986 | 123.35 | 790 | 774 | 172.0 |
| A | 14 | 111 | 10448 | 56.25 | 790 | 774 | 172.0 |
| B | 3 | 64 | 214012 | 1395.3 | 811 | 793 | 152.8 |
| B | 15 | 222 | 68727 | 444.56 | 811 | 793 | 152.8 |
| B | 4 | 80 | 50562 | 325.69 | 811 | 793 | 152.8 |
| C | 0 | 207 | 26887 | 145.41 | 772 | 768 | 179.6 |
| C | 13 | 61 | 4584 | 21.24 | 772 | 768 | 179.6 |
| C | 3 | 233 | 3532 | 15.39 | 772 | 768 | 179.6 |
| D | 7 | 238 | 3572023 | 20067.74 | 764 | 738 | 178.0 |
| D | 1 | 52 | 1202505 | 6752.96 | 764 | 738 | 178.0 |
| D | 2 | 234 | 59037 | 327.59 | 764 | 738 | 178.0 |
Histogram calculated using DETX and DETY for each event in the final _common_clean file
| Quadrant A |  |
 |
Quadrant B |
|---|---|---|---|
| Quadrant D |  |
 |
Quadrant C |
| Plot type | Count rate plots | Images |
|---|---|---|
| Comparison with Poisson distribution Blue bars denote a histogram of data divided into 1 sec bins. Red curve is a Poisson curve with rate = median count rate of data. |
 |
 |
| Quadrant-wise count rates Data is divided into 100 sec bins |
 |
|
| Module-wise count rates for Quadrant A Data is divided into 100 sec bins |
 |
 |
| Module-wise count rates for Quadrant B Data is divided into 100 sec bins |
 |
 |
| Module-wise count rates for Quadrant C Data is divided into 100 sec bins |
 |
 |
| Module-wise count rates for Quadrant D Data is divided into 100 sec bins |
 |
 |
| Parameter | Plot |
|---|---|
| CZT HV Monitor | 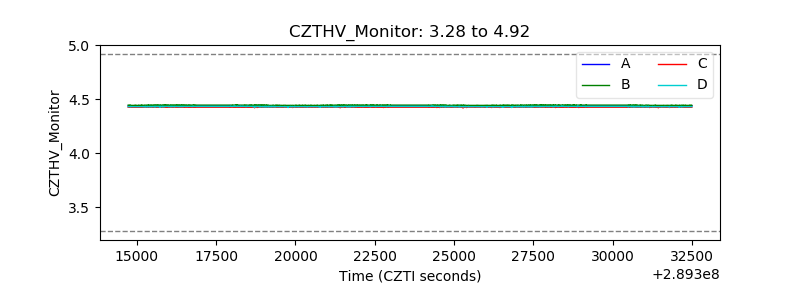 |
| D_VDD |  |
| Temperature 1 |  |
| Veto HV Monitor |  |
| Veto LLD |  |
| Alpha Counter | 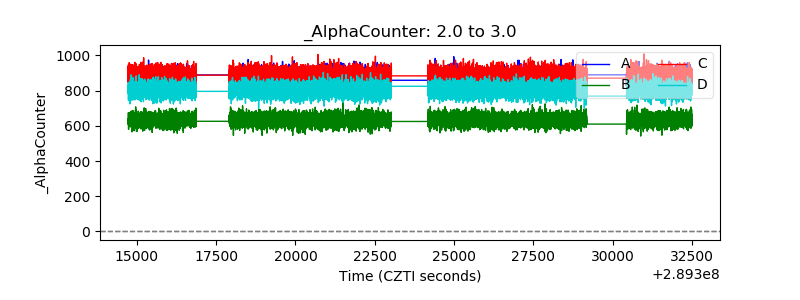 |
| _CPM_Rate |  |
| CZT Counter | 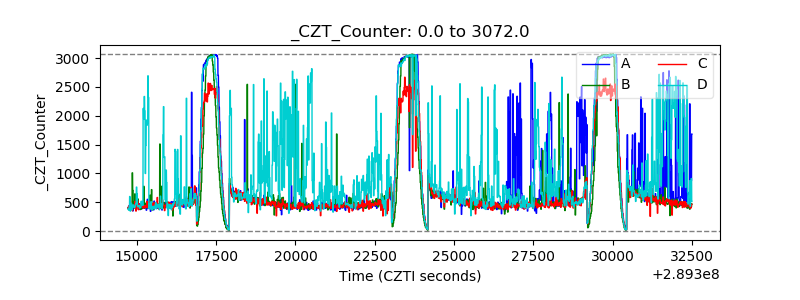 |
| +2.5 Volts monitor |  |
| +5 Volts monitor |  |
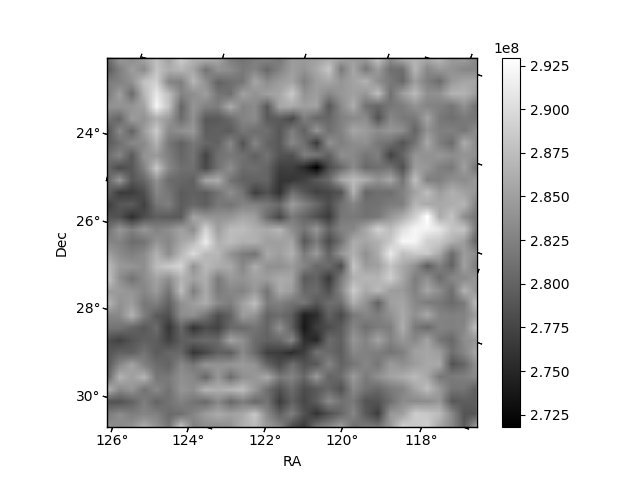
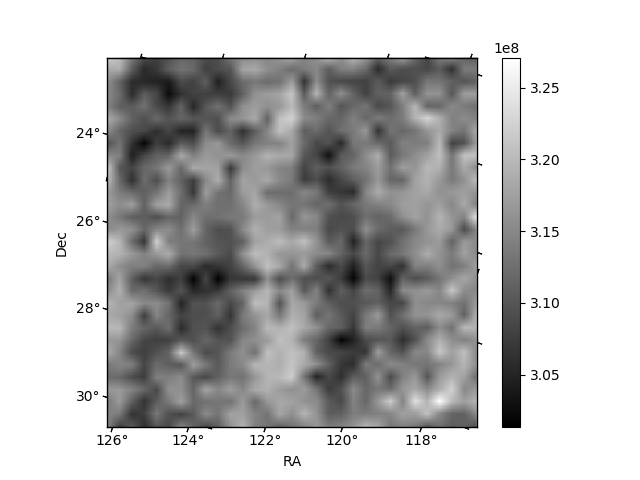
| _ROLL_ROT |  |
| _Roll_DEC | 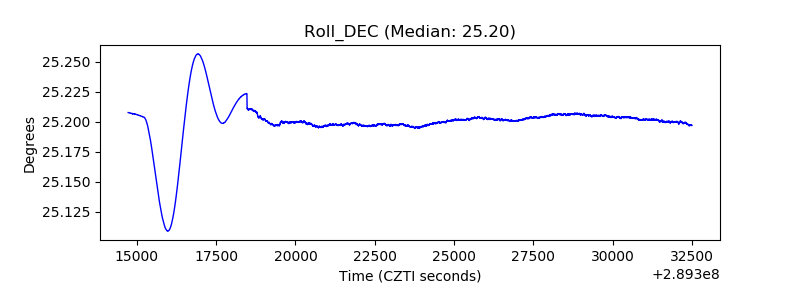 |
| _Roll_RA |  |
| Veto Counter | 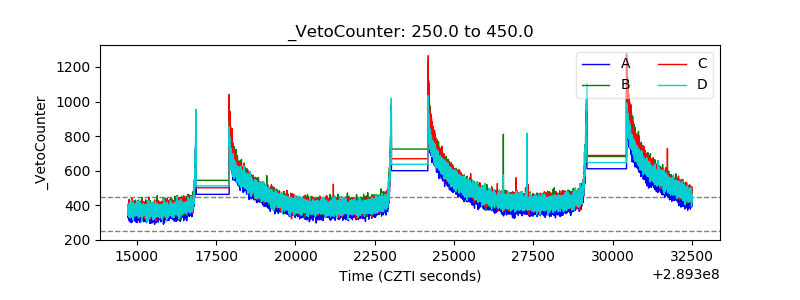 |