| Param | Original file | Final file |
|---|---|---|
| Filename | modeM0/AS1A05_103T02_9000002750cztM0_level2_bc.evt | modeM0/AS1A05_103T02_9000002750cztM0_level2_quad_clean.evt |
| Size (bytes) | 677,047,680 | 265,884,480 |
| Size | 645.7 MB | 253.6 MB |
| Events in quadrant A | 4,138,968 | 1,670,435 |
| Events in quadrant B | 4,201,118 | 1,708,195 |
| Events in quadrant C | 3,839,620 | 1,668,003 |
| Events in quadrant D | 6,936,686 | 1,610,892 |
| Mode M9 | |||
|---|---|---|---|
| Quadrant | BADHDUFLAG | Total packets | Discarded packets |
| A | 0 | 24 | 0 |
| B | 0 | 24 | 0 |
| C | 0 | 24 | 0 |
| D | 0 | 24 | 0 |
| Mode M0 | |||
|---|---|---|---|
| Quadrant | BADHDUFLAG | Total packets | Discarded packets |
| A | 0 | 42299 | 0 |
| B | 0 | 42497 | 0 |
| C | 0 | 41596 | 0 |
| D | 0 | 51619 | 0 |
| Mode SS | |||
|---|---|---|---|
| Quadrant | BADHDUFLAG | Total packets | Discarded packets |
| A | 0 | 414 | 0 |
| B | 0 | 414 | 0 |
| C | 0 | 414 | 0 |
| D | 0 | 414 | 0 |
| Quadrant | Total seconds | Saturated seconds | Saturation percentage |
|---|---|---|---|
| A | 20261 | 364 | 1.796555% |
| B | 20261 | 371 | 1.831104% |
| C | 20261 | 371 | 1.831104% |
| D | 20261 | 805 | 3.973150% |
Noise dominated data is calculated using 1-second bins in cleaned event files. If a bin has >2000 counts, and if more than 50% of those come from <1% of pixels, then it is considered to be noise-dominated and hence unusable.
| Quadrant | # 1 sec bins | Bins with >0 counts | Bins with >2000 counts | High rate bins dominated by noise | Noise dominated (total time) | Noise dominated (detector-on time) | Marked lightcurve |
|---|---|---|---|---|---|---|---|
| A | 22711 | 20257 | 2 | 2 | 0.01% | 0.01% |  |
| B | 22711 | 20257 | 4 | 4 | 0.02% | 0.02% |  |
| C | 22711 | 20257 | 0 | 0 | 0.00% | 0.00% |  |
| D | 22711 | 20259 | 99 | 99 | 0.44% | 0.49% |  |
Top three noisy pixels from each quadrant. If the there are fewer than three noisy pixels in the level2.evt file, extra rows are filled as -1
| Pixel properties | Quadrant properties | ||||||
|---|---|---|---|---|---|---|---|
| Quadrant | DetID | PixID | Counts | Sigma | Mean | Median | Sigma |
| A | 0 | 13 | 194295 | 872.08 | 1011 | 986 | 221.7 |
| A | 13 | 254 | 31151 | 136.08 | 1011 | 986 | 221.7 |
| A | 15 | 174 | 14420 | 60.6 | 1011 | 986 | 221.7 |
| B | 7 | 220 | 73906 | 365.88 | 1028 | 997 | 199.3 |
| B | 15 | 222 | 39793 | 194.69 | 1028 | 997 | 199.3 |
| B | 3 | 64 | 27680 | 133.91 | 1028 | 997 | 199.3 |
| C | 3 | 233 | 13499 | 53.76 | 989 | 981 | 232.8 |
| C | 8 | 128 | 11382 | 44.67 | 989 | 981 | 232.8 |
| C | 7 | 247 | 6614 | 24.19 | 989 | 981 | 232.8 |
| D | 7 | 238 | 1657073 | 7143.89 | 1001 | 965 | 231.8 |
| D | 1 | 52 | 830611 | 3578.81 | 1001 | 965 | 231.8 |
| D | 15 | 0 | 185141 | 794.47 | 1001 | 965 | 231.8 |
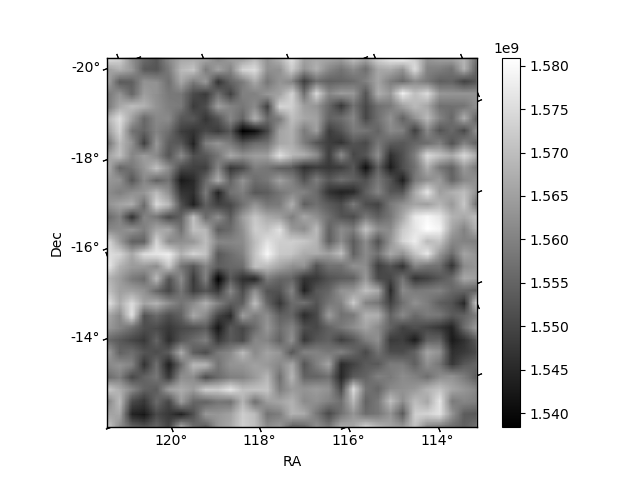
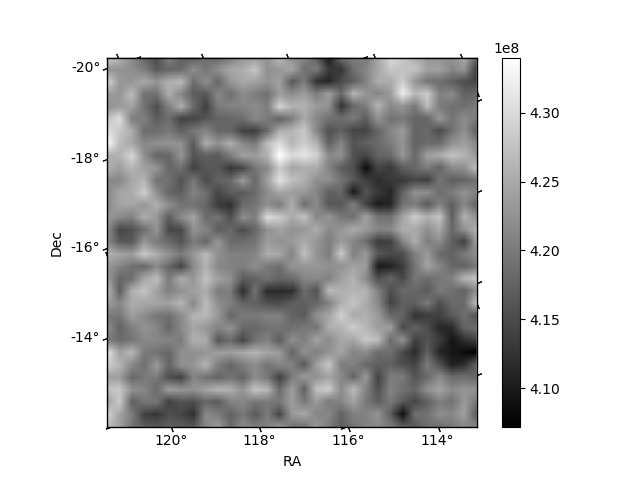
Histogram calculated using DETX and DETY for each event in the final _common_clean file
| Quadrant A |  |
 |
Quadrant B |
|---|---|---|---|
| Quadrant D |  |
 |
Quadrant C |
| Plot type | Count rate plots | Images |
|---|---|---|
| Comparison with Poisson distribution Blue bars denote a histogram of data divided into 1 sec bins. Red curve is a Poisson curve with rate = median count rate of data. |
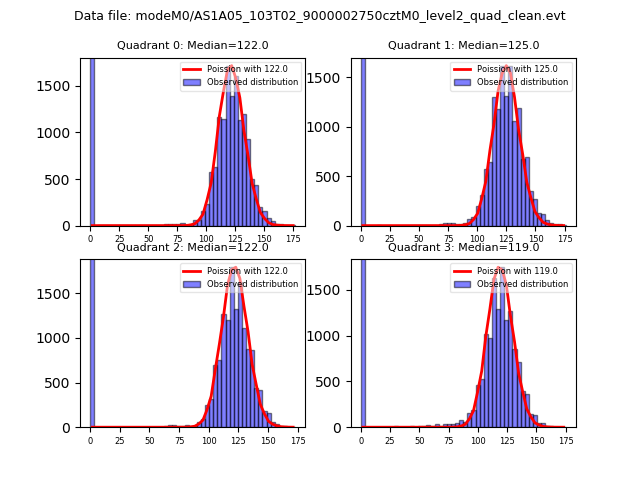 |
 |
| Quadrant-wise count rates Data is divided into 100 sec bins |
 |
|
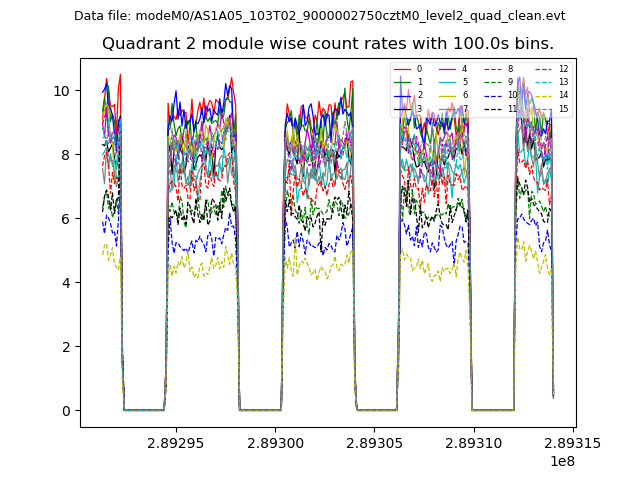
| Module-wise count rates for Quadrant A Data is divided into 100 sec bins |
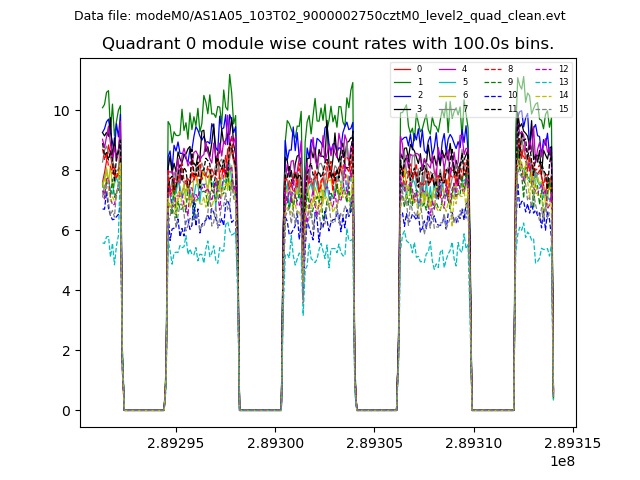 |
 |
| Module-wise count rates for Quadrant B Data is divided into 100 sec bins |
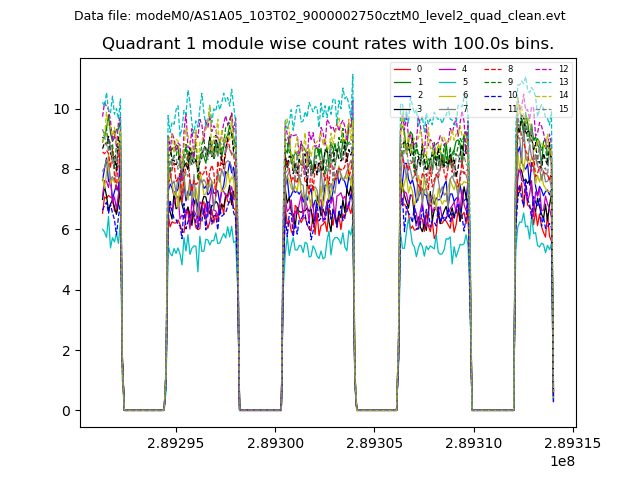 |
 |
| Module-wise count rates for Quadrant C Data is divided into 100 sec bins |
 |
 |
| Module-wise count rates for Quadrant D Data is divided into 100 sec bins |
 |
 |
| Parameter | Plot |
|---|---|
| CZT HV Monitor |  |
| D_VDD |  |
| Temperature 1 |  |
| Veto HV Monitor | 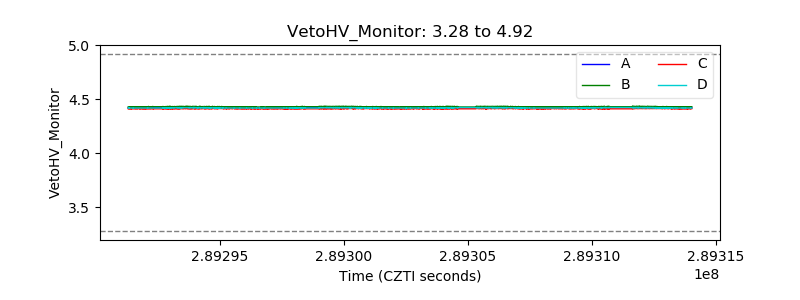 |
| Veto LLD |  |
| Alpha Counter | 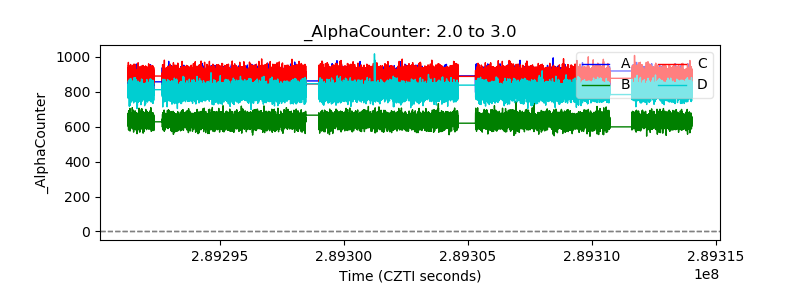 |
| _CPM_Rate |  |
| CZT Counter | 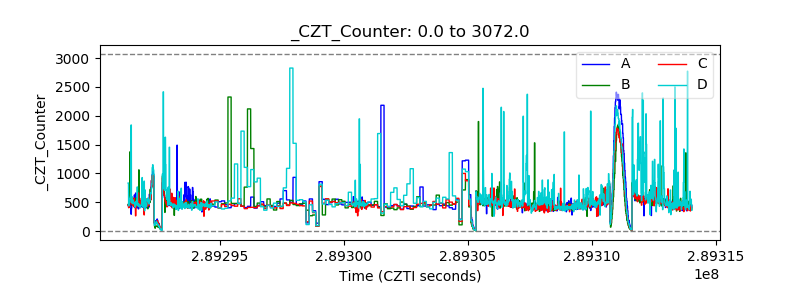 |
| +2.5 Volts monitor |  |
| +5 Volts monitor |  |
| _ROLL_ROT |  |
| _Roll_DEC |  |
| _Roll_RA | 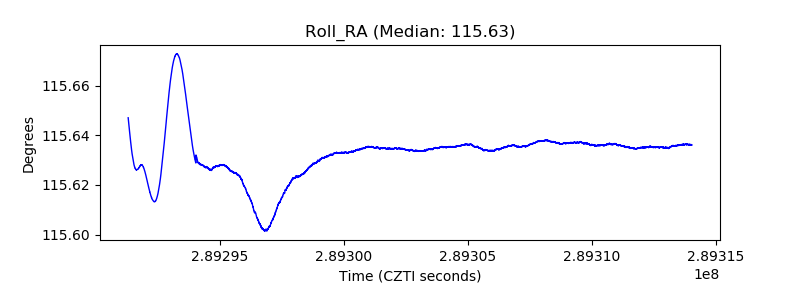 |
| Veto Counter | 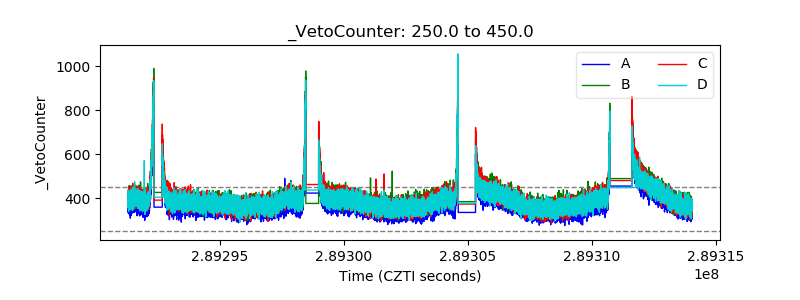 |