| Param | Original file | Final file |
|---|---|---|
| Filename | modeM0/AS1A05_082T12_9000002754cztM0_level2_bc.evt | modeM0/AS1A05_082T12_9000002754cztM0_level2_quad_clean.evt |
| Size (bytes) | 1,083,706,560 | 295,194,240 |
| Size | 1.0 GB | 281.5 MB |
| Events in quadrant A | 10,897,178 | 1,808,416 |
| Events in quadrant B | 4,886,617 | 2,009,811 |
| Events in quadrant C | 4,134,379 | 1,949,963 |
| Events in quadrant D | 11,564,293 | 1,823,512 |
| Mode SS | |||
|---|---|---|---|
| Quadrant | BADHDUFLAG | Total packets | Discarded packets |
| A | 0 | 402 | 0 |
| B | 0 | 402 | 0 |
| C | 0 | 402 | 0 |
| D | 0 | 402 | 0 |
| Mode M9 | |||
|---|---|---|---|
| Quadrant | BADHDUFLAG | Total packets | Discarded packets |
| A | 0 | 48 | 0 |
| B | 0 | 48 | 0 |
| C | 0 | 48 | 0 |
| D | 0 | 48 | 0 |
| Mode M0 | |||
|---|---|---|---|
| Quadrant | BADHDUFLAG | Total packets | Discarded packets |
| A | 0 | 68098 | 0 |
| B | 0 | 43736 | 0 |
| C | 0 | 41473 | 0 |
| D | 0 | 68927 | 0 |
| Quadrant | Total seconds | Saturated seconds | Saturation percentage |
|---|---|---|---|
| A | 19567 | 3151 | 16.103644% |
| B | 19567 | 458 | 2.340676% |
| C | 19567 | 309 | 1.579189% |
| D | 19567 | 2464 | 12.592630% |
Noise dominated data is calculated using 1-second bins in cleaned event files. If a bin has >2000 counts, and if more than 50% of those come from <1% of pixels, then it is considered to be noise-dominated and hence unusable.
| Quadrant | # 1 sec bins | Bins with >0 counts | Bins with >2000 counts | High rate bins dominated by noise | Noise dominated (total time) | Noise dominated (detector-on time) | Marked lightcurve |
|---|---|---|---|---|---|---|---|
| A | 24447 | 19566 | 413 | 413 | 1.69% | 2.11% |  |
| B | 24447 | 19567 | 27 | 27 | 0.11% | 0.14% |  |
| C | 24447 | 19567 | 0 | 0 | 0.00% | 0.00% |  |
| D | 24447 | 19565 | 237 | 237 | 0.97% | 1.21% |  |
Top three noisy pixels from each quadrant. If the there are fewer than three noisy pixels in the level2.evt file, extra rows are filled as -1
| Pixel properties | Quadrant properties | ||||||
|---|---|---|---|---|---|---|---|
| Quadrant | DetID | PixID | Counts | Sigma | Mean | Median | Sigma |
| A | 0 | 13 | 6962370 | 32014.62 | 1005 | 986 | 217.4 |
| A | 13 | 254 | 27405 | 121.5 | 1005 | 986 | 217.4 |
| A | 13 | 210 | 24487 | 108.08 | 1005 | 986 | 217.4 |
| B | 3 | 64 | 352926 | 1694.32 | 1107 | 1079 | 207.7 |
| B | 4 | 80 | 114082 | 544.16 | 1107 | 1079 | 207.7 |
| B | 7 | 220 | 85608 | 407.05 | 1107 | 1079 | 207.7 |
| C | 3 | 233 | 15966 | 60.05 | 1068 | 1065 | 248.2 |
| C | 9 | 54 | 11676 | 42.76 | 1068 | 1065 | 248.2 |
| C | 13 | 61 | 6472 | 21.79 | 1068 | 1065 | 248.2 |
| D | 7 | 238 | 5750092 | 24231.96 | 1034 | 999 | 237.3 |
| D | 1 | 52 | 950549 | 4002.28 | 1034 | 999 | 237.3 |
| D | 13 | 153 | 660739 | 2780.75 | 1034 | 999 | 237.3 |
Histogram calculated using DETX and DETY for each event in the final _common_clean file
| Quadrant A |  |
 |
Quadrant B |
|---|---|---|---|
| Quadrant D |  |
 |
Quadrant C |
| Plot type | Count rate plots | Images |
|---|---|---|
| Comparison with Poisson distribution Blue bars denote a histogram of data divided into 1 sec bins. Red curve is a Poisson curve with rate = median count rate of data. |
 |
 |
| Quadrant-wise count rates Data is divided into 100 sec bins |
 |
|
| Module-wise count rates for Quadrant A Data is divided into 100 sec bins |
 |
 |
| Module-wise count rates for Quadrant B Data is divided into 100 sec bins |
 |
 |
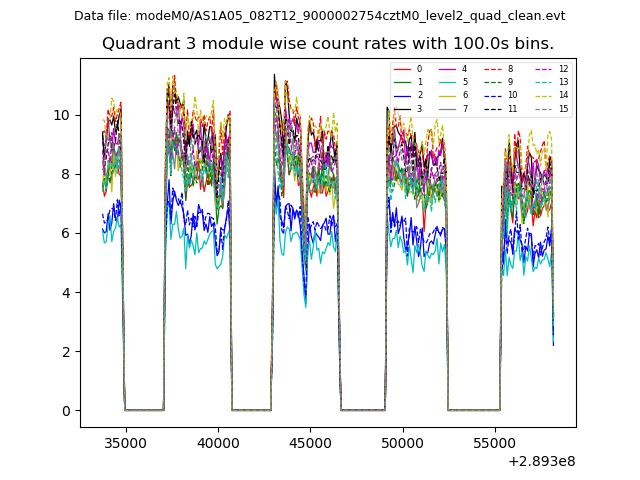
| Module-wise count rates for Quadrant C Data is divided into 100 sec bins |
 |
 |
| Module-wise count rates for Quadrant D Data is divided into 100 sec bins |
 |
 |
| Parameter | Plot |
|---|---|
| CZT HV Monitor | 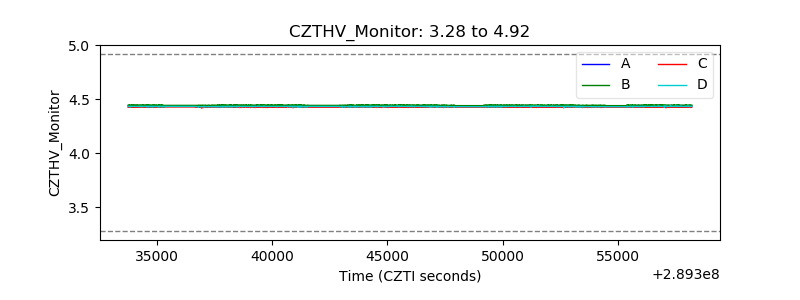 |
| D_VDD |  |
| Temperature 1 |  |
| Veto HV Monitor |  |
| Veto LLD |  |
| Alpha Counter |  |
| _CPM_Rate | 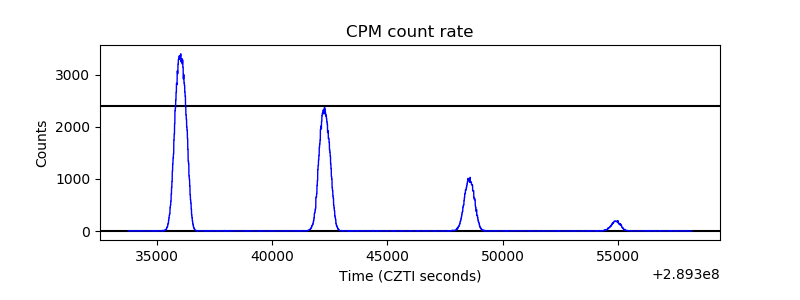 |
| CZT Counter |  |
| +2.5 Volts monitor |  |
| +5 Volts monitor |  |
| _ROLL_ROT | 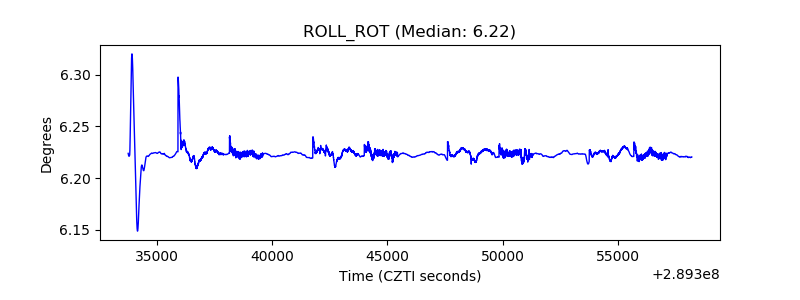 |
| _Roll_DEC |  |
| _Roll_RA |  |
| Veto Counter | 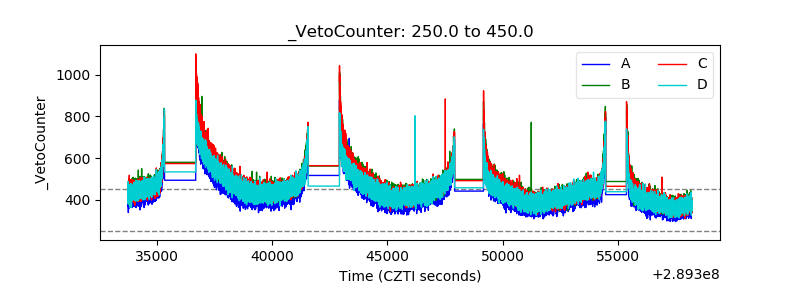 |