| Param | Original file | Final file |
|---|---|---|
| Filename | modeM0/AS1A05_212T07_9000002746cztM0_level2_bc.evt | modeM0/AS1A05_212T07_9000002746cztM0_level2_quad_clean.evt |
| Size (bytes) | 622,512,000 | 254,946,240 |
| Size | 593.7 MB | 243.1 MB |
| Events in quadrant A | 4,442,967 | 1,600,734 |
| Events in quadrant B | 4,140,174 | 1,643,667 |
| Events in quadrant C | 3,820,254 | 1,593,668 |
| Events in quadrant D | 5,138,595 | 1,565,908 |
| Mode M9 | |||
|---|---|---|---|
| Quadrant | BADHDUFLAG | Total packets | Discarded packets |
| A | 0 | 38 | 0 |
| B | 0 | 38 | 0 |
| C | 0 | 38 | 0 |
| D | 0 | 38 | 0 |
| Mode M0 | |||
|---|---|---|---|
| Quadrant | BADHDUFLAG | Total packets | Discarded packets |
| A | 0 | 41641 | 0 |
| B | 0 | 40553 | 0 |
| C | 0 | 39918 | 0 |
| D | 0 | 44196 | 0 |
| Mode SS | |||
|---|---|---|---|
| Quadrant | BADHDUFLAG | Total packets | Discarded packets |
| A | 0 | 392 | 0 |
| B | 0 | 392 | 0 |
| C | 0 | 392 | 0 |
| D | 0 | 392 | 0 |
| Quadrant | Total seconds | Saturated seconds | Saturation percentage |
|---|---|---|---|
| A | 19126 | 311 | 1.626059% |
| B | 19126 | 242 | 1.265293% |
| C | 19126 | 282 | 1.474433% |
| D | 19126 | 569 | 2.975008% |
Noise dominated data is calculated using 1-second bins in cleaned event files. If a bin has >2000 counts, and if more than 50% of those come from <1% of pixels, then it is considered to be noise-dominated and hence unusable.
| Quadrant | # 1 sec bins | Bins with >0 counts | Bins with >2000 counts | High rate bins dominated by noise | Noise dominated (total time) | Noise dominated (detector-on time) | Marked lightcurve |
|---|---|---|---|---|---|---|---|
| A | 22976 | 19122 | 11 | 11 | 0.05% | 0.06% |  |
| B | 22976 | 19123 | 3 | 3 | 0.01% | 0.02% |  |
| C | 22976 | 19122 | 0 | 0 | 0.00% | 0.00% |  |
| D | 22976 | 19123 | 18 | 18 | 0.08% | 0.09% |  |
Top three noisy pixels from each quadrant. If the there are fewer than three noisy pixels in the level2.evt file, extra rows are filled as -1
| Pixel properties | Quadrant properties | ||||||
|---|---|---|---|---|---|---|---|
| Quadrant | DetID | PixID | Counts | Sigma | Mean | Median | Sigma |
| A | 0 | 13 | 468914 | 2126.01 | 1009 | 990 | 220.1 |
| A | 15 | 174 | 42571 | 188.92 | 1009 | 990 | 220.1 |
| A | 13 | 254 | 27084 | 118.56 | 1009 | 990 | 220.1 |
| B | 6 | 36 | 52973 | 267.55 | 1029 | 1004 | 194.2 |
| B | 3 | 64 | 29858 | 148.55 | 1029 | 1004 | 194.2 |
| B | 0 | 230 | 24484 | 120.88 | 1029 | 1004 | 194.2 |
| C | 3 | 233 | 7799 | 29.28 | 988 | 983 | 232.8 |
| C | 5 | 112 | 7276 | 27.03 | 988 | 983 | 232.8 |
| C | 9 | 54 | 7077 | 26.18 | 988 | 983 | 232.8 |
| D | 1 | 52 | 931535 | 4026.46 | 993 | 957 | 231.1 |
| D | 7 | 238 | 147695 | 634.91 | 993 | 957 | 231.1 |
| D | 13 | 168 | 92987 | 398.2 | 993 | 957 | 231.1 |
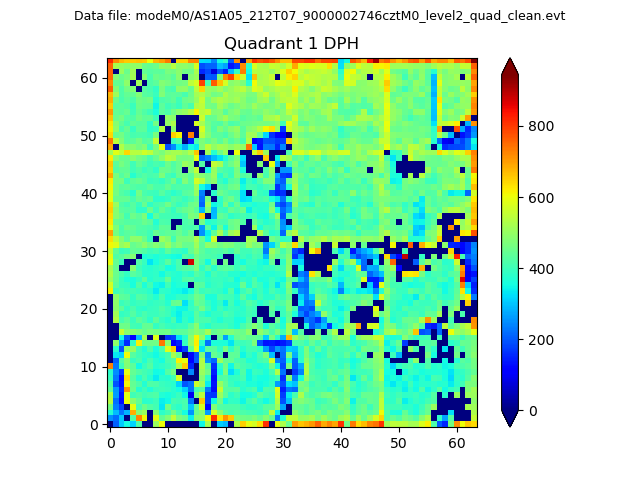
Histogram calculated using DETX and DETY for each event in the final _common_clean file
| Quadrant A |  |
 |
Quadrant B |
|---|---|---|---|
| Quadrant D |  |
 |
Quadrant C |
| Plot type | Count rate plots | Images |
|---|---|---|
| Comparison with Poisson distribution Blue bars denote a histogram of data divided into 1 sec bins. Red curve is a Poisson curve with rate = median count rate of data. |
 |
 |
| Quadrant-wise count rates Data is divided into 100 sec bins |
 |
|
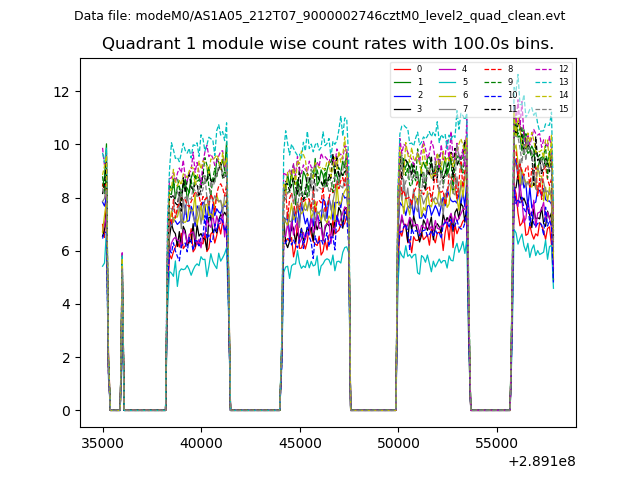
| Module-wise count rates for Quadrant A Data is divided into 100 sec bins |
 |
 |
| Module-wise count rates for Quadrant B Data is divided into 100 sec bins |
 |
 |
| Module-wise count rates for Quadrant C Data is divided into 100 sec bins |
 |
 |
| Module-wise count rates for Quadrant D Data is divided into 100 sec bins |
 |
 |
| Parameter | Plot |
|---|---|
| CZT HV Monitor |  |
| D_VDD | 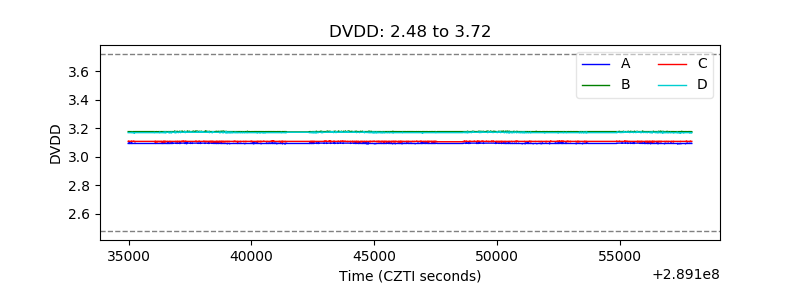 |
| Temperature 1 |  |
| Veto HV Monitor |  |
| Veto LLD |  |
| Alpha Counter |  |
| _CPM_Rate |  |
| CZT Counter |  |
| +2.5 Volts monitor |  |
| +5 Volts monitor |  |
| _ROLL_ROT | 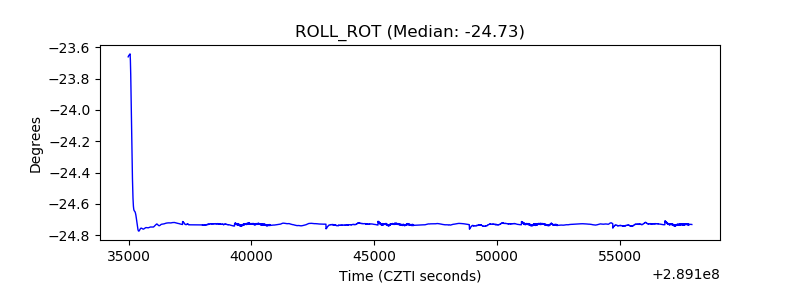 |
| _Roll_DEC |  |
| _Roll_RA | 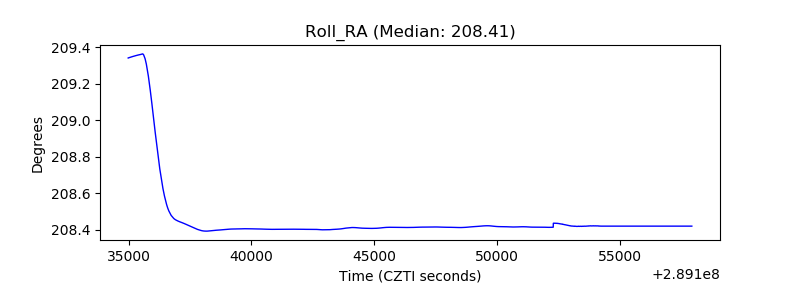 |
| Veto Counter |  |