| Param | Original file | Final file |
|---|---|---|
| Filename | modeM0/AS1T03_083T01_9000002742cztM0_level2_bc.evt | modeM0/AS1T03_083T01_9000002742cztM0_level2_quad_clean.evt |
| Size (bytes) | 1,113,264,000 | 512,899,200 |
| Size | 1.0 GB | 489.1 MB |
| Events in quadrant A | 8,462,118 | 3,457,494 |
| Events in quadrant B | 9,471,453 | 3,464,668 |
| Events in quadrant C | 6,306,134 | 3,351,861 |
| Events in quadrant D | 7,496,146 | 3,269,592 |
| Mode M9 | |||
|---|---|---|---|
| Quadrant | BADHDUFLAG | Total packets | Discarded packets |
| A | 0 | 48 | 0 |
| B | 0 | 48 | 0 |
| C | 0 | 48 | 0 |
| D | 0 | 48 | 0 |
| Mode M0 | |||
|---|---|---|---|
| Quadrant | BADHDUFLAG | Total packets | Discarded packets |
| A | 0 | 68030 | 0 |
| B | 0 | 70962 | 0 |
| C | 0 | 61675 | 0 |
| D | 0 | 63771 | 0 |
| Mode SS | |||
|---|---|---|---|
| Quadrant | BADHDUFLAG | Total packets | Discarded packets |
| A | 0 | 588 | 0 |
| B | 0 | 588 | 0 |
| C | 0 | 588 | 0 |
| D | 0 | 588 | 0 |
| Quadrant | Total seconds | Saturated seconds | Saturation percentage |
|---|---|---|---|
| A | 28991 | 784 | 2.704288% |
| B | 28991 | 1218 | 4.201304% |
| C | 28991 | 444 | 1.531510% |
| D | 28991 | 349 | 1.203822% |
Noise dominated data is calculated using 1-second bins in cleaned event files. If a bin has >2000 counts, and if more than 50% of those come from <1% of pixels, then it is considered to be noise-dominated and hence unusable.
| Quadrant | # 1 sec bins | Bins with >0 counts | Bins with >2000 counts | High rate bins dominated by noise | Noise dominated (total time) | Noise dominated (detector-on time) | Marked lightcurve |
|---|---|---|---|---|---|---|---|
| A | 33701 | 28987 | 105 | 105 | 0.31% | 0.36% |  |
| B | 33701 | 28987 | 218 | 218 | 0.65% | 0.75% |  |
| C | 33701 | 28987 | 0 | 0 | 0.00% | 0.00% |  |
| D | 33701 | 28986 | 40 | 40 | 0.12% | 0.14% |  |
Top three noisy pixels from each quadrant. If the there are fewer than three noisy pixels in the level2.evt file, extra rows are filled as -1
| Pixel properties | Quadrant properties | ||||||
|---|---|---|---|---|---|---|---|
| Quadrant | DetID | PixID | Counts | Sigma | Mean | Median | Sigma |
| A | 0 | 13 | 1980798 | 5711.01 | 1556 | 1530 | 346.6 |
| A | 4 | 2 | 293730 | 843.12 | 1556 | 1530 | 346.6 |
| A | 15 | 174 | 123706 | 352.53 | 1556 | 1530 | 346.6 |
| B | 10 | 245 | 3128035 | 10437.08 | 1560 | 1524 | 299.6 |
| B | 7 | 220 | 93204 | 306.05 | 1560 | 1524 | 299.6 |
| B | 0 | 197 | 45456 | 146.65 | 1560 | 1524 | 299.6 |
| C | 3 | 233 | 457458 | 1272.22 | 1500 | 1499 | 358.4 |
| C | 7 | 247 | 58931 | 160.25 | 1500 | 1499 | 358.4 |
| C | 8 | 128 | 12330 | 30.22 | 1500 | 1499 | 358.4 |
| D | 7 | 238 | 532111 | 1470.27 | 1523 | 1473 | 360.9 |
| D | 1 | 52 | 515203 | 1423.42 | 1523 | 1473 | 360.9 |
| D | 12 | 110 | 319632 | 881.54 | 1523 | 1473 | 360.9 |
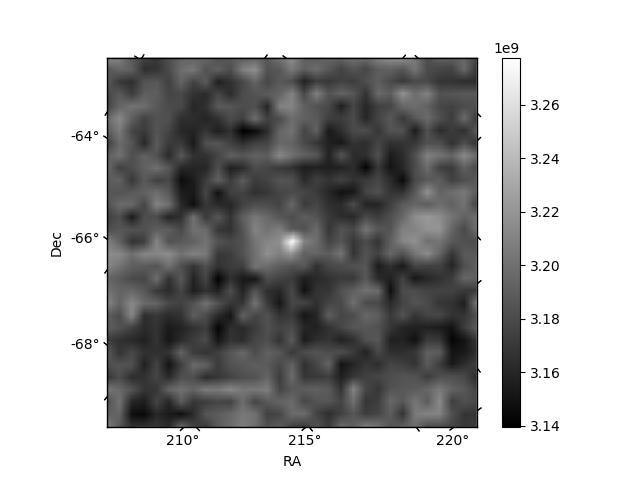
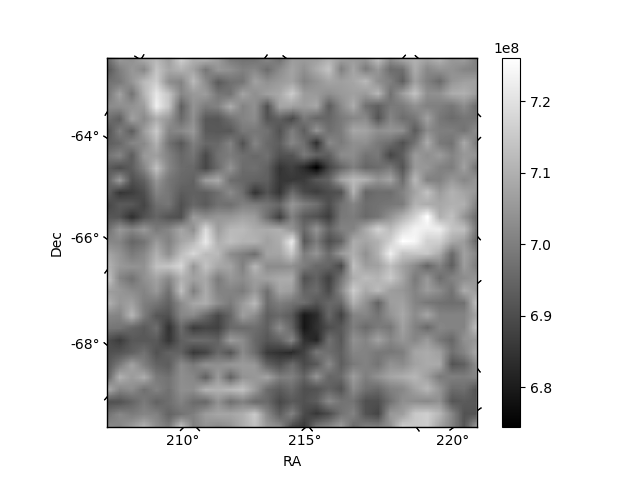
Histogram calculated using DETX and DETY for each event in the final _common_clean file
| Quadrant A |  |
 |
Quadrant B |
|---|---|---|---|
| Quadrant D |  |
 |
Quadrant C |
| Plot type | Count rate plots | Images |
|---|---|---|
| Comparison with Poisson distribution Blue bars denote a histogram of data divided into 1 sec bins. Red curve is a Poisson curve with rate = median count rate of data. |
 |
 |
| Quadrant-wise count rates Data is divided into 100 sec bins |
 |
|
| Module-wise count rates for Quadrant A Data is divided into 100 sec bins |
 |
 |
| Module-wise count rates for Quadrant B Data is divided into 100 sec bins |
 |
 |
| Module-wise count rates for Quadrant C Data is divided into 100 sec bins |
 |
 |
| Module-wise count rates for Quadrant D Data is divided into 100 sec bins |
 |
 |
| Parameter | Plot |
|---|---|
| CZT HV Monitor | 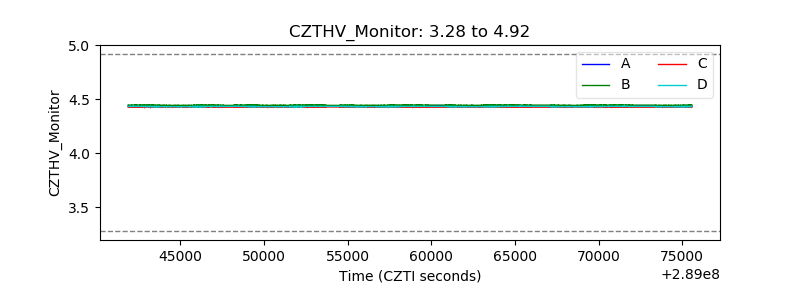 |
| D_VDD |  |
| Temperature 1 |  |
| Veto HV Monitor |  |
| Veto LLD |  |
| Alpha Counter |  |
| _CPM_Rate | 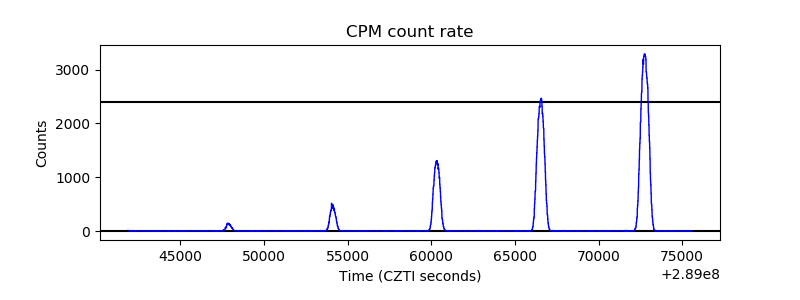 |
| CZT Counter |  |
| +2.5 Volts monitor |  |
| +5 Volts monitor |  |
| _ROLL_ROT |  |
| _Roll_DEC |  |
| _Roll_RA | 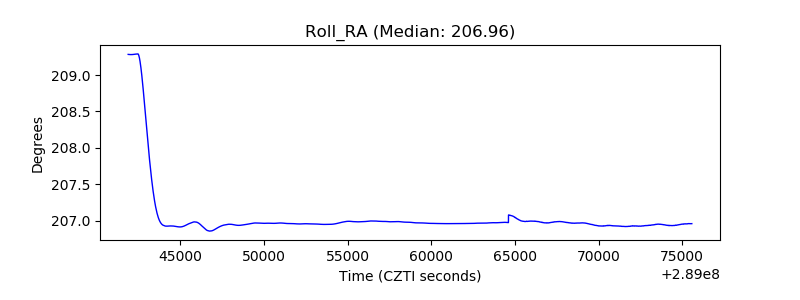 |
| Veto Counter |  |