| Param | Original file | Final file |
|---|---|---|
| Filename | modeM0/AS1A05_075T08_9000002744cztM0_level2_bc.evt | modeM0/AS1A05_075T08_9000002744cztM0_level2_quad_clean.evt |
| Size (bytes) | 1,711,656,000 | 661,766,400 |
| Size | 1.6 GB | 631.1 MB |
| Events in quadrant A | 14,683,512 | 4,095,728 |
| Events in quadrant B | 11,764,882 | 4,307,883 |
| Events in quadrant C | 9,975,441 | 4,166,915 |
| Events in quadrant D | 12,004,948 | 4,045,752 |
| Mode M0 | |||
|---|---|---|---|
| Quadrant | BADHDUFLAG | Total packets | Discarded packets |
| A | 0 | 120818 | 0 |
| B | 0 | 109036 | 0 |
| C | 0 | 104216 | 0 |
| D | 0 | 109499 | 0 |
| Mode SS | |||
|---|---|---|---|
| Quadrant | BADHDUFLAG | Total packets | Discarded packets |
| A | 0 | 1016 | 0 |
| B | 0 | 1014 | 0 |
| C | 0 | 1012 | 0 |
| D | 0 | 1018 | 0 |
| Mode M9 | |||
|---|---|---|---|
| Quadrant | BADHDUFLAG | Total packets | Discarded packets |
| A | 0 | 68 | 0 |
| B | 0 | 68 | 0 |
| C | 0 | 68 | 0 |
| D | 0 | 68 | 0 |
| Quadrant | Total seconds | Saturated seconds | Saturation percentage |
|---|---|---|---|
| A | 49884 | 2280 | 4.570604% |
| B | 49959 | 1124 | 2.249845% |
| C | 49963 | 978 | 1.957449% |
| D | 49957 | 858 | 1.717477% |
Noise dominated data is calculated using 1-second bins in cleaned event files. If a bin has >2000 counts, and if more than 50% of those come from <1% of pixels, then it is considered to be noise-dominated and hence unusable.
| Quadrant | # 1 sec bins | Bins with >0 counts | Bins with >2000 counts | High rate bins dominated by noise | Noise dominated (total time) | Noise dominated (detector-on time) | Marked lightcurve |
|---|---|---|---|---|---|---|---|
| A | 57627 | 50223 | 96 | 96 | 0.17% | 0.19% |  |
| B | 57627 | 50281 | 13 | 13 | 0.02% | 0.03% |  |
| C | 57627 | 50277 | 0 | 0 | 0.00% | 0.00% |  |
| D | 57627 | 50287 | 34 | 34 | 0.06% | 0.07% |  |
Top three noisy pixels from each quadrant. If the there are fewer than three noisy pixels in the level2.evt file, extra rows are filled as -1
| Pixel properties | Quadrant properties | ||||||
|---|---|---|---|---|---|---|---|
| Quadrant | DetID | PixID | Counts | Sigma | Mean | Median | Sigma |
| A | 0 | 13 | 4270999 | 7574.27 | 2582 | 2529 | 563.5 |
| A | 15 | 174 | 206484 | 361.91 | 2582 | 2529 | 563.5 |
| A | 15 | 192 | 124855 | 217.06 | 2582 | 2529 | 563.5 |
| B | 10 | 245 | 1094318 | 2154.62 | 2678 | 2609 | 506.7 |
| B | 7 | 220 | 142261 | 275.62 | 2678 | 2609 | 506.7 |
| B | 0 | 244 | 51215 | 95.93 | 2678 | 2609 | 506.7 |
| C | 3 | 233 | 45127 | 71.32 | 2564 | 2558 | 596.8 |
| C | 7 | 247 | 22434 | 33.3 | 2564 | 2558 | 596.8 |
| C | 9 | 54 | 21567 | 31.85 | 2564 | 2558 | 596.8 |
| D | 7 | 238 | 764394 | 1274.5 | 2600 | 2506 | 597.8 |
| D | 7 | 38 | 399764 | 664.54 | 2600 | 2506 | 597.8 |
| D | 1 | 52 | 385670 | 640.96 | 2600 | 2506 | 597.8 |
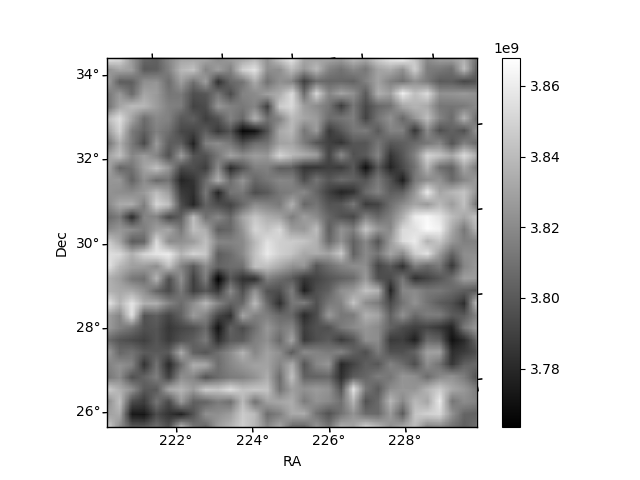
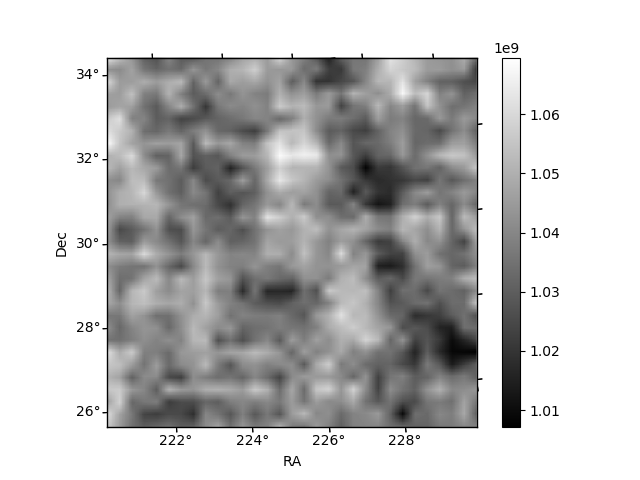
Histogram calculated using DETX and DETY for each event in the final _common_clean file
| Quadrant A |  |
 |
Quadrant B |
|---|---|---|---|
| Quadrant D |  |
 |
Quadrant C |
| Plot type | Count rate plots | Images |
|---|---|---|
| Comparison with Poisson distribution Blue bars denote a histogram of data divided into 1 sec bins. Red curve is a Poisson curve with rate = median count rate of data. |
 |
 |
| Quadrant-wise count rates Data is divided into 100 sec bins |
 |
|
| Module-wise count rates for Quadrant A Data is divided into 100 sec bins |
 |
 |
| Module-wise count rates for Quadrant B Data is divided into 100 sec bins |
 |
 |
| Module-wise count rates for Quadrant C Data is divided into 100 sec bins |
 |
 |
| Module-wise count rates for Quadrant D Data is divided into 100 sec bins |
 |
 |
| Parameter | Plot |
|---|---|
| CZT HV Monitor |  |
| D_VDD |  |
| Temperature 1 |  |
| Veto HV Monitor |  |
| Veto LLD |  |
| Alpha Counter |  |
| _CPM_Rate |  |
| CZT Counter |  |
| +2.5 Volts monitor |  |
| +5 Volts monitor |  |
| _ROLL_ROT |  |
| _Roll_DEC |  |
| _Roll_RA |  |
| Veto Counter |  |