| Param | Original file | Final file |
|---|---|---|
| Filename | modeM0/AS1A05_075T09_9000002740cztM0_level2_bc.evt | modeM0/AS1A05_075T09_9000002740cztM0_level2_quad_clean.evt |
| Size (bytes) | 2,220,197,760 | 716,080,320 |
| Size | 2.1 GB | 682.9 MB |
| Events in quadrant A | 22,625,594 | 4,392,270 |
| Events in quadrant B | 13,990,013 | 4,734,068 |
| Events in quadrant C | 14,119,000 | 4,591,131 |
| Events in quadrant D | 13,024,400 | 4,468,428 |
| Mode M9 | |||
|---|---|---|---|
| Quadrant | BADHDUFLAG | Total packets | Discarded packets |
| A | 0 | 78 | 0 |
| B | 0 | 78 | 0 |
| C | 0 | 78 | 0 |
| D | 0 | 78 | 0 |
| Mode SS | |||
|---|---|---|---|
| Quadrant | BADHDUFLAG | Total packets | Discarded packets |
| A | 0 | 1040 | 0 |
| B | 0 | 1040 | 0 |
| C | 0 | 1040 | 0 |
| D | 0 | 1040 | 0 |
| Mode M0 | |||
|---|---|---|---|
| Quadrant | BADHDUFLAG | Total packets | Discarded packets |
| A | 0 | 156486 | 0 |
| B | 0 | 117535 | 0 |
| C | 0 | 120440 | 0 |
| D | 0 | 113705 | 0 |
| Quadrant | Total seconds | Saturated seconds | Saturation percentage |
|---|---|---|---|
| A | 51031 | 6763 | 13.252729% |
| B | 51031 | 1426 | 2.794380% |
| C | 51031 | 1240 | 2.429896% |
| D | 51031 | 840 | 1.646058% |
Noise dominated data is calculated using 1-second bins in cleaned event files. If a bin has >2000 counts, and if more than 50% of those come from <1% of pixels, then it is considered to be noise-dominated and hence unusable.
| Quadrant | # 1 sec bins | Bins with >0 counts | Bins with >2000 counts | High rate bins dominated by noise | Noise dominated (total time) | Noise dominated (detector-on time) | Marked lightcurve |
|---|---|---|---|---|---|---|---|
| A | 59096 | 51025 | 124 | 124 | 0.21% | 0.24% | 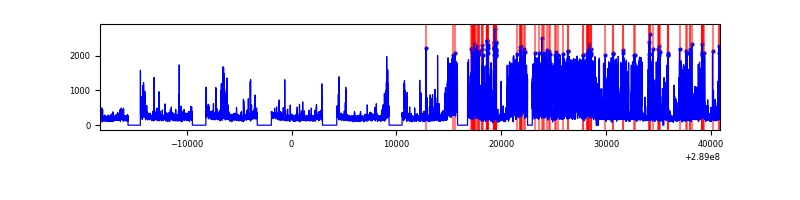 |
| B | 59096 | 51022 | 138 | 138 | 0.23% | 0.27% | 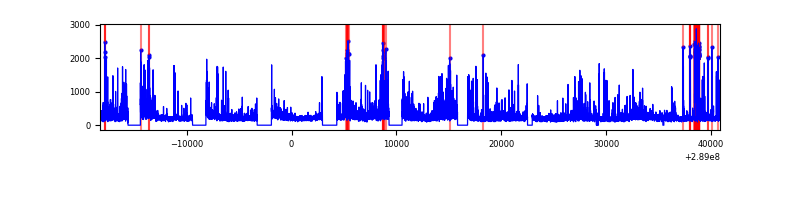 |
| C | 59096 | 51026 | 0 | 0 | 0.00% | 0.00% |  |
| D | 59096 | 51029 | 63 | 63 | 0.11% | 0.12% |  |
Top three noisy pixels from each quadrant. If the there are fewer than three noisy pixels in the level2.evt file, extra rows are filled as -1
| Pixel properties | Quadrant properties | ||||||
|---|---|---|---|---|---|---|---|
| Quadrant | DetID | PixID | Counts | Sigma | Mean | Median | Sigma |
| A | 0 | 13 | 11610500 | 20514.78 | 2600 | 2551 | 565.8 |
| A | 15 | 174 | 682563 | 1201.79 | 2600 | 2551 | 565.8 |
| A | 4 | 2 | 275587 | 482.54 | 2600 | 2551 | 565.8 |
| B | 10 | 245 | 2819857 | 5382.55 | 2790 | 2719 | 523.4 |
| B | 7 | 220 | 78036 | 143.9 | 2790 | 2719 | 523.4 |
| B | 4 | 216 | 68700 | 126.07 | 2790 | 2719 | 523.4 |
| C | 3 | 233 | 3705961 | 5922.95 | 2689 | 2679 | 625.2 |
| C | 9 | 54 | 35224 | 52.05 | 2689 | 2679 | 625.2 |
| C | 8 | 128 | 21960 | 30.84 | 2689 | 2679 | 625.2 |
| D | 7 | 238 | 1077176 | 1726.69 | 2729 | 2634 | 622.3 |
| D | 1 | 52 | 1029985 | 1650.86 | 2729 | 2634 | 622.3 |
| D | 2 | 234 | 230160 | 365.61 | 2729 | 2634 | 622.3 |
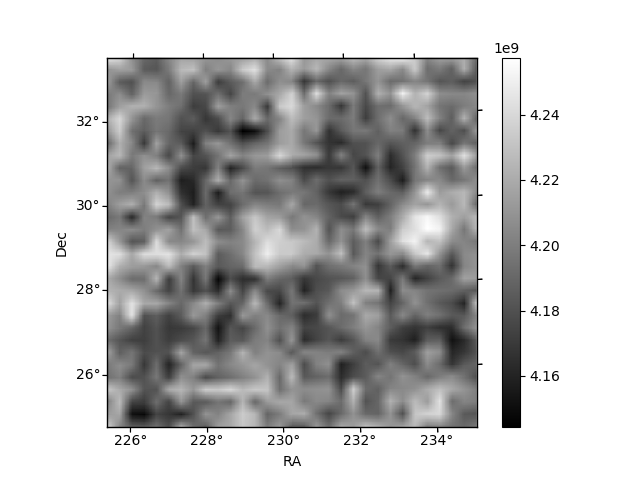
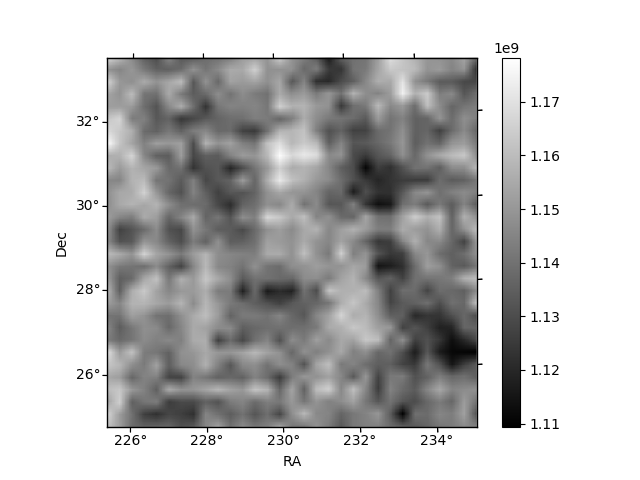
Histogram calculated using DETX and DETY for each event in the final _common_clean file
| Quadrant A |  |
 |
Quadrant B |
|---|---|---|---|
| Quadrant D |  |
 |
Quadrant C |
| Plot type | Count rate plots | Images |
|---|---|---|
| Comparison with Poisson distribution Blue bars denote a histogram of data divided into 1 sec bins. Red curve is a Poisson curve with rate = median count rate of data. |
 |
 |
| Quadrant-wise count rates Data is divided into 100 sec bins |
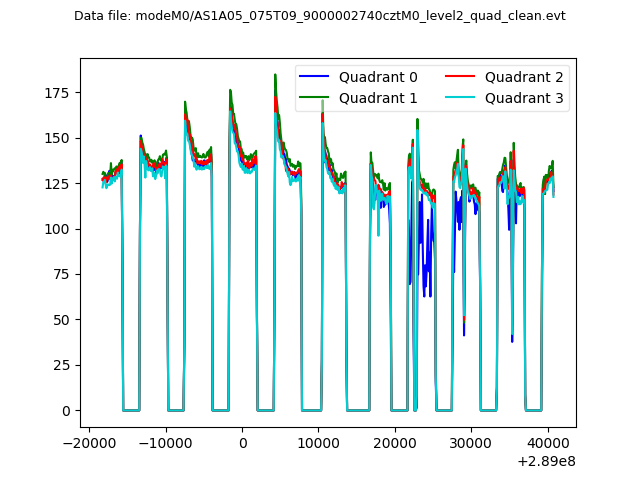 |
|
| Module-wise count rates for Quadrant A Data is divided into 100 sec bins |
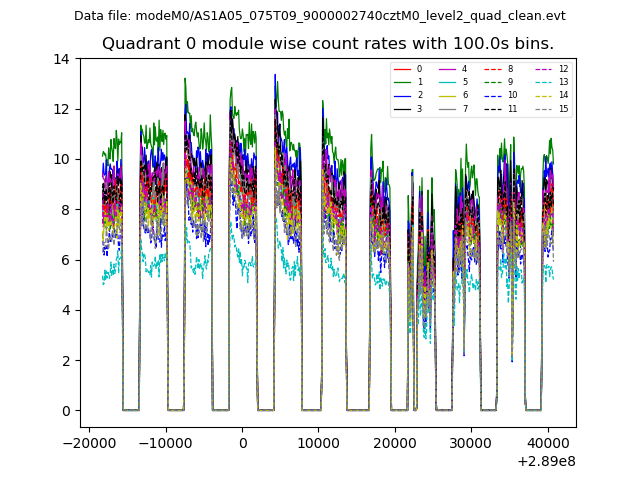 |
 |
| Module-wise count rates for Quadrant B Data is divided into 100 sec bins |
 |
 |
| Module-wise count rates for Quadrant C Data is divided into 100 sec bins |
 |
 |
| Module-wise count rates for Quadrant D Data is divided into 100 sec bins |
 |
 |
| Parameter | Plot |
|---|---|
| CZT HV Monitor | 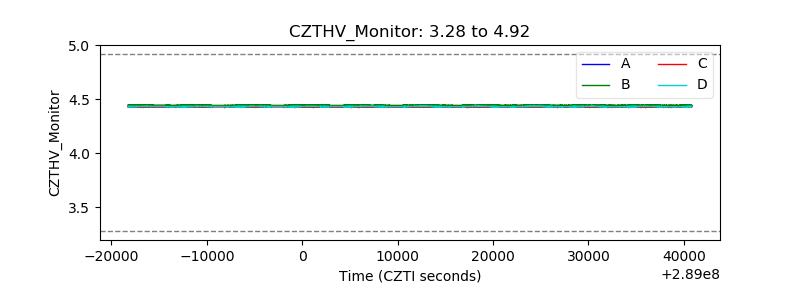 |
| D_VDD |  |
| Temperature 1 |  |
| Veto HV Monitor |  |
| Veto LLD |  |
| Alpha Counter | 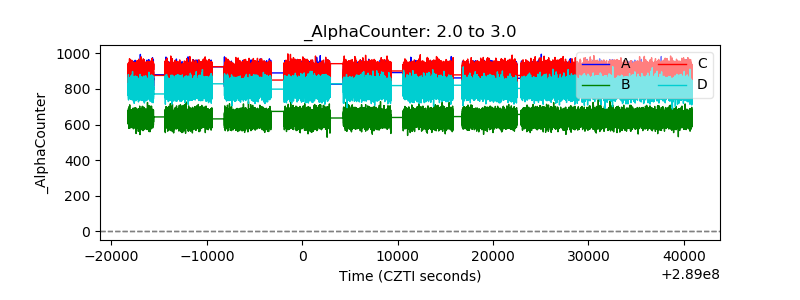 |
| _CPM_Rate | 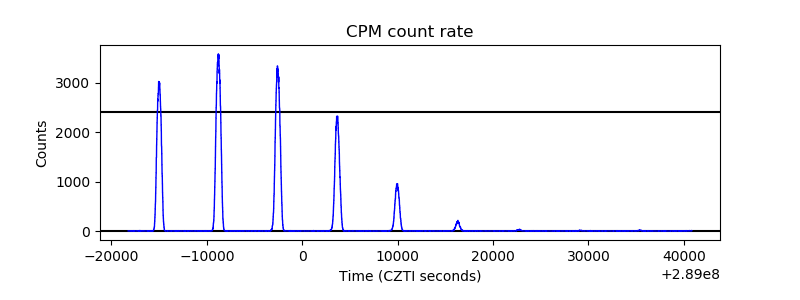 |
| CZT Counter |  |
| +2.5 Volts monitor |  |
| +5 Volts monitor |  |
| _ROLL_ROT |  |
| _Roll_DEC |  |
| _Roll_RA |  |
| Veto Counter | 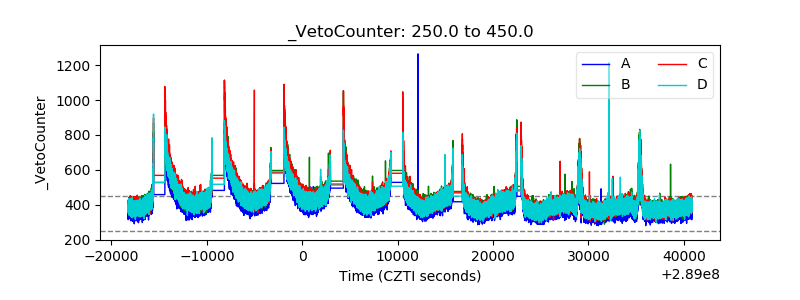 |