| Param | Original file | Final file |
|---|---|---|
| Filename | modeM0/AS1A05_144T02_9000002734cztM0_level2_bc.evt | modeM0/AS1A05_144T02_9000002734cztM0_level2_quad_clean.evt |
| Size (bytes) | 1,786,907,520 | 611,377,920 |
| Size | 1.7 GB | 583.1 MB |
| Events in quadrant A | 14,038,411 | 3,878,900 |
| Events in quadrant B | 14,378,414 | 4,034,133 |
| Events in quadrant C | 8,576,138 | 3,869,076 |
| Events in quadrant D | 14,131,836 | 3,724,952 |
| Mode M0 | |||
|---|---|---|---|
| Quadrant | BADHDUFLAG | Total packets | Discarded packets |
| A | 0 | 111669 | 0 |
| B | 0 | 111175 | 0 |
| C | 0 | 90193 | 0 |
| D | 0 | 106436 | 0 |
| Mode SS | |||
|---|---|---|---|
| Quadrant | BADHDUFLAG | Total packets | Discarded packets |
| A | 0 | 892 | 0 |
| B | 0 | 892 | 0 |
| C | 0 | 892 | 0 |
| D | 0 | 892 | 0 |
| Mode M9 | |||
|---|---|---|---|
| Quadrant | BADHDUFLAG | Total packets | Discarded packets |
| A | 0 | 52 | 0 |
| B | 0 | 52 | 0 |
| C | 0 | 52 | 0 |
| D | 0 | 52 | 0 |
| Quadrant | Total seconds | Saturated seconds | Saturation percentage |
|---|---|---|---|
| A | 43855 | 2983 | 6.801961% |
| B | 43855 | 3041 | 6.934215% |
| C | 43855 | 696 | 1.587048% |
| D | 43855 | 1149 | 2.619998% |
Noise dominated data is calculated using 1-second bins in cleaned event files. If a bin has >2000 counts, and if more than 50% of those come from <1% of pixels, then it is considered to be noise-dominated and hence unusable.
| Quadrant | # 1 sec bins | Bins with >0 counts | Bins with >2000 counts | High rate bins dominated by noise | Noise dominated (total time) | Noise dominated (detector-on time) | Marked lightcurve |
|---|---|---|---|---|---|---|---|
| A | 49010 | 43847 | 171 | 171 | 0.35% | 0.39% |  |
| B | 49010 | 43846 | 415 | 415 | 0.85% | 0.95% | 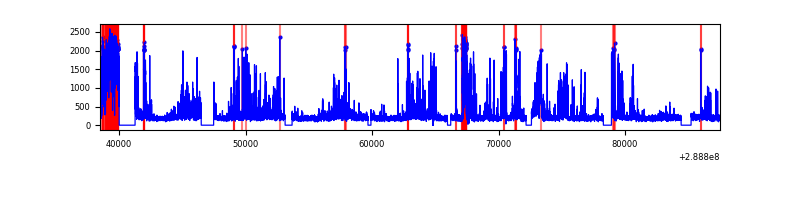 |
| C | 49010 | 43852 | 4 | 4 | 0.01% | 0.01% | 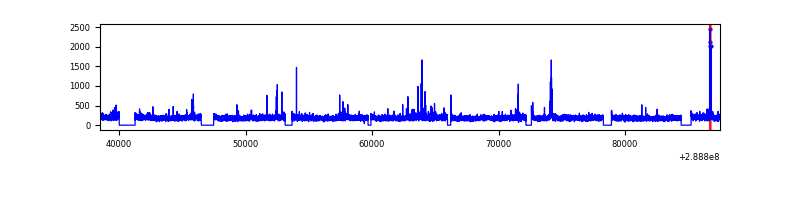 |
| D | 49010 | 43850 | 108 | 108 | 0.22% | 0.25% |  |
Top three noisy pixels from each quadrant. If the there are fewer than three noisy pixels in the level2.evt file, extra rows are filled as -1
| Pixel properties | Quadrant properties | ||||||
|---|---|---|---|---|---|---|---|
| Quadrant | DetID | PixID | Counts | Sigma | Mean | Median | Sigma |
| A | 0 | 13 | 5086244 | 10850.96 | 2131 | 2089 | 468.5 |
| A | 14 | 238 | 368556 | 782.14 | 2131 | 2089 | 468.5 |
| A | 15 | 174 | 202745 | 428.25 | 2131 | 2089 | 468.5 |
| B | 10 | 245 | 2815784 | 6774.52 | 2190 | 2130 | 415.3 |
| B | 15 | 222 | 2103669 | 5059.94 | 2190 | 2130 | 415.3 |
| B | 7 | 220 | 678381 | 1628.23 | 2190 | 2130 | 415.3 |
| C | 3 | 233 | 292285 | 574.78 | 2128 | 2111 | 504.8 |
| C | 0 | 207 | 61480 | 117.6 | 2128 | 2111 | 504.8 |
| C | 9 | 54 | 20871 | 37.16 | 2128 | 2111 | 504.8 |
| D | 7 | 238 | 2286028 | 4523.62 | 2145 | 2068 | 504.9 |
| D | 13 | 168 | 1243233 | 2458.25 | 2145 | 2068 | 504.9 |
| D | 8 | 230 | 629543 | 1242.78 | 2145 | 2068 | 504.9 |
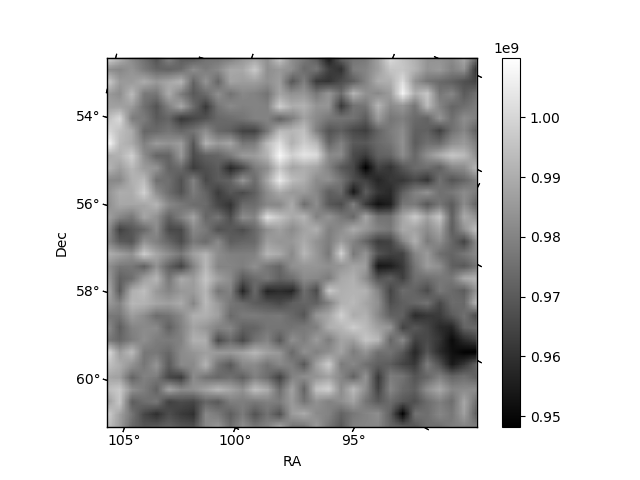
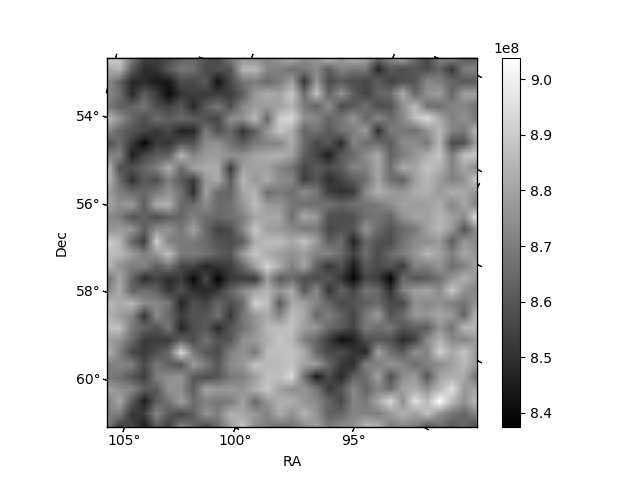
Histogram calculated using DETX and DETY for each event in the final _common_clean file
| Quadrant A |  |
 |
Quadrant B |
|---|---|---|---|
| Quadrant D |  |
 |
Quadrant C |
| Plot type | Count rate plots | Images |
|---|---|---|
| Comparison with Poisson distribution Blue bars denote a histogram of data divided into 1 sec bins. Red curve is a Poisson curve with rate = median count rate of data. |
 |
 |
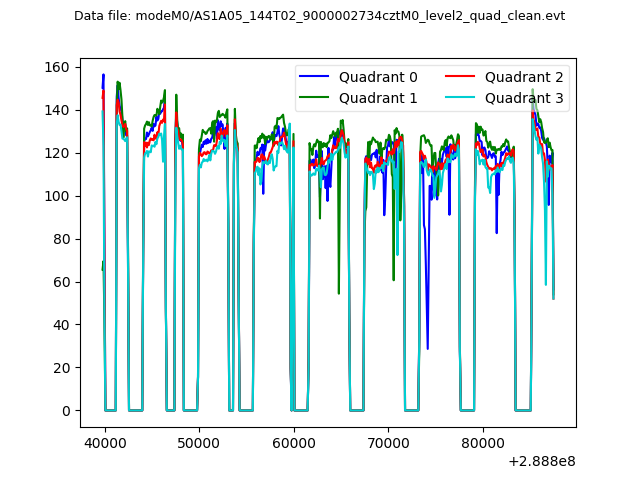
| Quadrant-wise count rates Data is divided into 100 sec bins |
 |
|
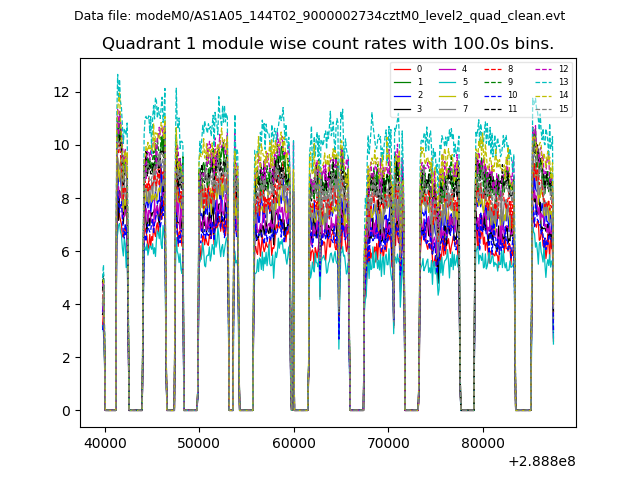
| Module-wise count rates for Quadrant A Data is divided into 100 sec bins |
 |
 |
| Module-wise count rates for Quadrant B Data is divided into 100 sec bins |
 |
 |
| Module-wise count rates for Quadrant C Data is divided into 100 sec bins |
 |
 |
| Module-wise count rates for Quadrant D Data is divided into 100 sec bins |
 |
 |
| Parameter | Plot |
|---|---|
| CZT HV Monitor |  |
| D_VDD |  |
| Temperature 1 |  |
| Veto HV Monitor |  |
| Veto LLD |  |
| Alpha Counter | 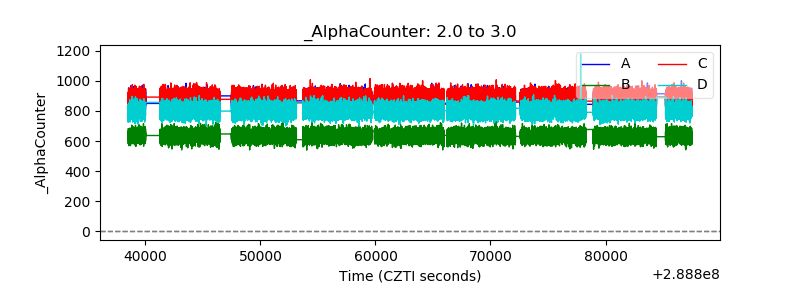 |
| _CPM_Rate | 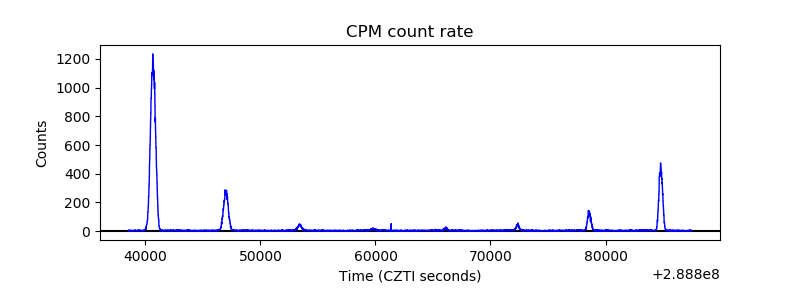 |
| CZT Counter |  |
| +2.5 Volts monitor |  |
| +5 Volts monitor | 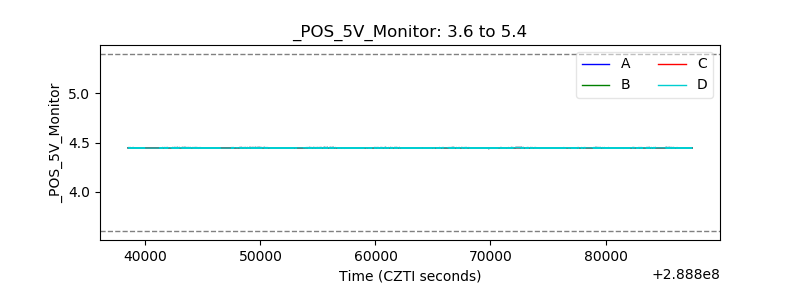 |
| _ROLL_ROT |  |
| _Roll_DEC |  |
| _Roll_RA | 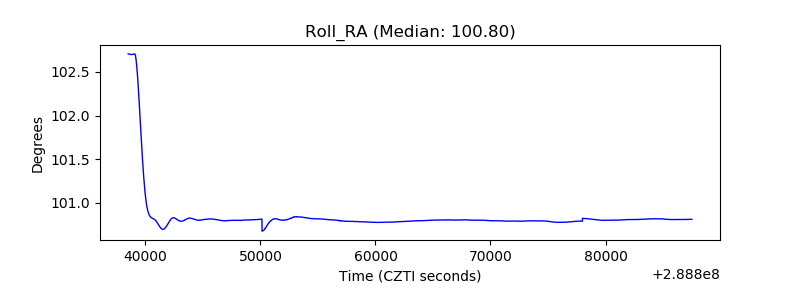 |
| Veto Counter | 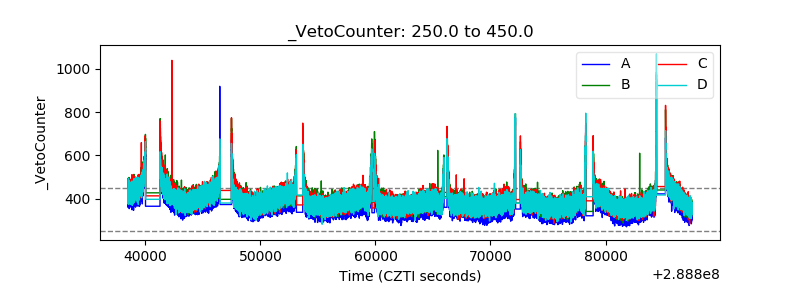 |