| Param | Original file | Final file |
|---|---|---|
| Filename | modeM0/AS1A05_072T02_9000002736cztM0_level2_bc.evt | modeM0/AS1A05_072T02_9000002736cztM0_level2_quad_clean.evt |
| Size (bytes) | 2,163,026,880 | 791,262,720 |
| Size | 2.0 GB | 754.6 MB |
| Events in quadrant A | 14,946,310 | 4,986,364 |
| Events in quadrant B | 15,544,368 | 5,144,415 |
| Events in quadrant C | 14,190,928 | 4,972,191 |
| Events in quadrant D | 16,781,273 | 4,794,072 |
| Mode M0 | |||
|---|---|---|---|
| Quadrant | BADHDUFLAG | Total packets | Discarded packets |
| A | 0 | 133805 | 0 |
| B | 0 | 135148 | 0 |
| C | 0 | 132622 | 0 |
| D | 0 | 137695 | 0 |
| Mode M9 | |||
|---|---|---|---|
| Quadrant | BADHDUFLAG | Total packets | Discarded packets |
| A | 0 | 99 | 0 |
| B | 0 | 99 | 0 |
| C | 0 | 99 | 0 |
| D | 0 | 99 | 0 |
| Mode SS | |||
|---|---|---|---|
| Quadrant | BADHDUFLAG | Total packets | Discarded packets |
| A | 0 | 1208 | 0 |
| B | 0 | 1208 | 0 |
| C | 0 | 1208 | 0 |
| D | 0 | 1208 | 0 |
| Quadrant | Total seconds | Saturated seconds | Saturation percentage |
|---|---|---|---|
| A | 59329 | 1402 | 2.363094% |
| B | 59329 | 1811 | 3.052470% |
| C | 59329 | 1182 | 1.992280% |
| D | 59329 | 1384 | 2.332755% |
Noise dominated data is calculated using 1-second bins in cleaned event files. If a bin has >2000 counts, and if more than 50% of those come from <1% of pixels, then it is considered to be noise-dominated and hence unusable.
| Quadrant | # 1 sec bins | Bins with >0 counts | Bins with >2000 counts | High rate bins dominated by noise | Noise dominated (total time) | Noise dominated (detector-on time) | Marked lightcurve |
|---|---|---|---|---|---|---|---|
| A | 69235 | 59319 | 57 | 57 | 0.08% | 0.10% |  |
| B | 69235 | 59321 | 162 | 162 | 0.23% | 0.27% |  |
| C | 69235 | 59327 | 2 | 2 | 0.00% | 0.00% |  |
| D | 69235 | 59320 | 264 | 264 | 0.38% | 0.45% |  |
Top three noisy pixels from each quadrant. If the there are fewer than three noisy pixels in the level2.evt file, extra rows are filled as -1
| Pixel properties | Quadrant properties | ||||||
|---|---|---|---|---|---|---|---|
| Quadrant | DetID | PixID | Counts | Sigma | Mean | Median | Sigma |
| A | 0 | 13 | 1465194 | 2172.04 | 3130 | 3069 | 673.2 |
| A | 15 | 174 | 1033092 | 1530.14 | 3130 | 3069 | 673.2 |
| A | 4 | 2 | 336523 | 495.36 | 3130 | 3069 | 673.2 |
| B | 10 | 245 | 2503694 | 4180.42 | 3191 | 3105 | 598.2 |
| B | 15 | 222 | 245590 | 405.38 | 3191 | 3105 | 598.2 |
| B | 7 | 220 | 107685 | 174.83 | 3191 | 3105 | 598.2 |
| C | 3 | 233 | 2264548 | 3155.49 | 3073 | 3054 | 716.7 |
| C | 9 | 54 | 66248 | 88.18 | 3073 | 3054 | 716.7 |
| C | 0 | 207 | 26532 | 32.76 | 3073 | 3054 | 716.7 |
| D | 7 | 238 | 2114859 | 2938.7 | 3113 | 3000 | 718.6 |
| D | 7 | 38 | 639638 | 885.9 | 3113 | 3000 | 718.6 |
| D | 13 | 168 | 590285 | 817.22 | 3113 | 3000 | 718.6 |
Histogram calculated using DETX and DETY for each event in the final _common_clean file
| Quadrant A |  |
 |
Quadrant B |
|---|---|---|---|
| Quadrant D |  |
 |
Quadrant C |
| Plot type | Count rate plots | Images |
|---|---|---|
| Comparison with Poisson distribution Blue bars denote a histogram of data divided into 1 sec bins. Red curve is a Poisson curve with rate = median count rate of data. |
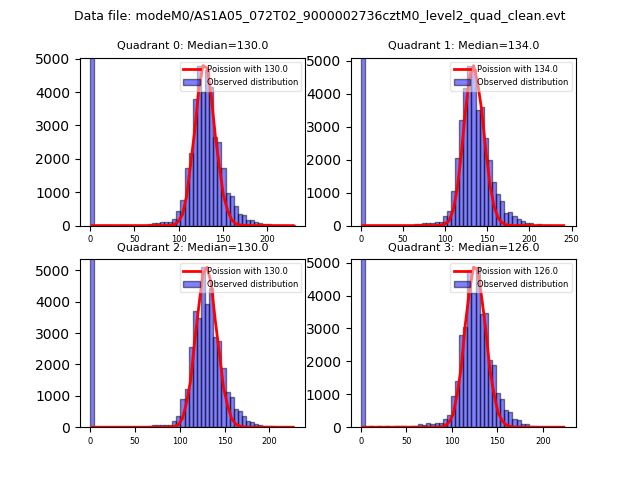 |
 |
| Quadrant-wise count rates Data is divided into 100 sec bins |
 |
|
| Module-wise count rates for Quadrant A Data is divided into 100 sec bins |
 |
 |
| Module-wise count rates for Quadrant B Data is divided into 100 sec bins |
 |
 |
| Module-wise count rates for Quadrant C Data is divided into 100 sec bins |
 |
 |
| Module-wise count rates for Quadrant D Data is divided into 100 sec bins |
 |
 |
| Parameter | Plot |
|---|---|
| CZT HV Monitor |  |
| D_VDD |  |
| Temperature 1 |  |
| Veto HV Monitor |  |
| Veto LLD |  |
| Alpha Counter | 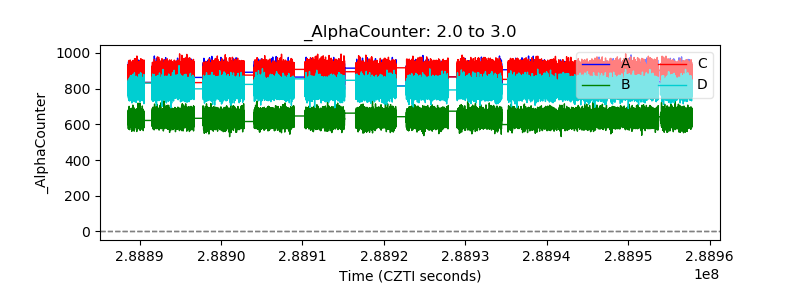 |
| _CPM_Rate |  |
| CZT Counter |  |
| +2.5 Volts monitor |  |
| +5 Volts monitor |  |
| _ROLL_ROT |  |
| _Roll_DEC |  |
| _Roll_RA |  |
| Veto Counter | 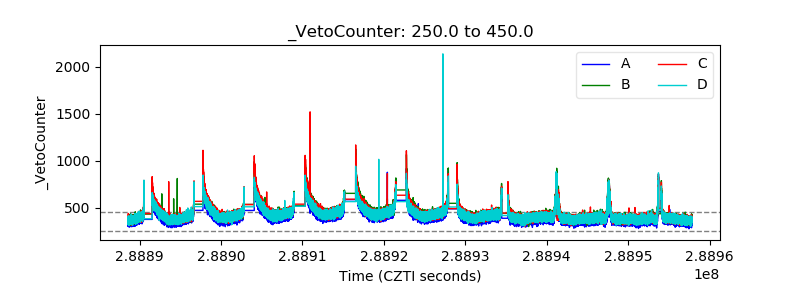 |