| Param | Original file | Final file |
|---|---|---|
| Filename | modeM0/AS1T03_083T01_9000002728cztM0_level2_bc.evt | modeM0/AS1T03_083T01_9000002728cztM0_level2_quad_clean.evt |
| Size (bytes) | 1,119,242,880 | 477,391,680 |
| Size | 1.0 GB | 455.3 MB |
| Events in quadrant A | 5,994,602 | 3,245,000 |
| Events in quadrant B | 10,777,598 | 3,219,772 |
| Events in quadrant C | 5,752,854 | 3,109,695 |
| Events in quadrant D | 9,478,717 | 2,980,199 |
| Mode M0 | |||
|---|---|---|---|
| Quadrant | BADHDUFLAG | Total packets | Discarded packets |
| A | 0 | 57961 | 0 |
| B | 0 | 75674 | 0 |
| C | 0 | 57586 | 0 |
| D | 0 | 68771 | 0 |
| Mode SS | |||
|---|---|---|---|
| Quadrant | BADHDUFLAG | Total packets | Discarded packets |
| A | 0 | 562 | 0 |
| B | 0 | 562 | 0 |
| C | 0 | 562 | 0 |
| D | 0 | 562 | 0 |
| Mode M9 | |||
|---|---|---|---|
| Quadrant | BADHDUFLAG | Total packets | Discarded packets |
| A | 0 | 48 | 0 |
| B | 0 | 48 | 0 |
| C | 0 | 48 | 0 |
| D | 0 | 48 | 0 |
| Quadrant | Total seconds | Saturated seconds | Saturation percentage |
|---|---|---|---|
| A | 27731 | 305 | 1.099852% |
| B | 27731 | 935 | 3.371678% |
| C | 27731 | 321 | 1.157549% |
| D | 27731 | 842 | 3.036313% |
Noise dominated data is calculated using 1-second bins in cleaned event files. If a bin has >2000 counts, and if more than 50% of those come from <1% of pixels, then it is considered to be noise-dominated and hence unusable.
| Quadrant | # 1 sec bins | Bins with >0 counts | Bins with >2000 counts | High rate bins dominated by noise | Noise dominated (total time) | Noise dominated (detector-on time) | Marked lightcurve |
|---|---|---|---|---|---|---|---|
| A | 32380 | 27731 | 7 | 7 | 0.02% | 0.03% | 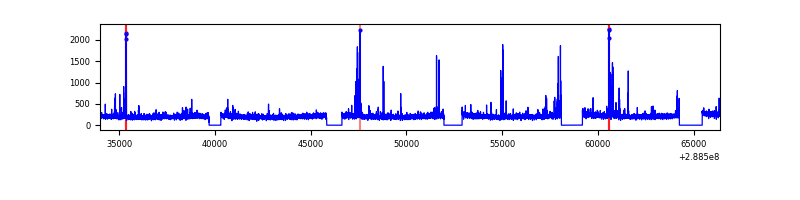 |
| B | 32380 | 27730 | 32 | 32 | 0.10% | 0.12% | 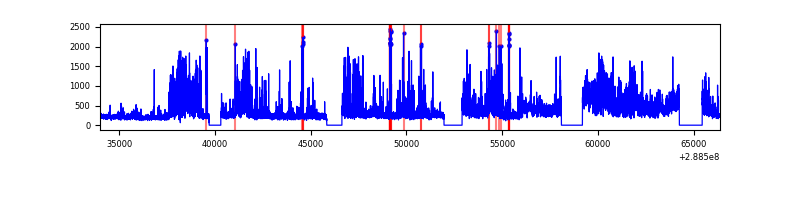 |
| C | 32380 | 27731 | 1 | 1 | 0.00% | 0.00% | 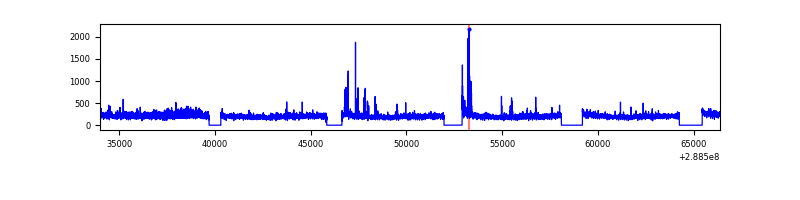 |
| D | 32380 | 27730 | 89 | 89 | 0.27% | 0.32% |  |
Top three noisy pixels from each quadrant. If the there are fewer than three noisy pixels in the level2.evt file, extra rows are filled as -1
| Pixel properties | Quadrant properties | ||||||
|---|---|---|---|---|---|---|---|
| Quadrant | DetID | PixID | Counts | Sigma | Mean | Median | Sigma |
| A | 15 | 174 | 255026 | 765.21 | 1474 | 1451 | 331.4 |
| A | 4 | 2 | 71671 | 211.9 | 1474 | 1451 | 331.4 |
| A | 0 | 254 | 11163 | 29.31 | 1474 | 1451 | 331.4 |
| B | 10 | 245 | 4675706 | 16383.2 | 1471 | 1438 | 285.3 |
| B | 0 | 189 | 101053 | 349.15 | 1471 | 1438 | 285.3 |
| B | 7 | 220 | 98280 | 339.43 | 1471 | 1438 | 285.3 |
| C | 3 | 233 | 194851 | 572.94 | 1410 | 1409 | 337.6 |
| C | 0 | 207 | 117491 | 343.81 | 1410 | 1409 | 337.6 |
| C | 9 | 160 | 10172 | 25.95 | 1410 | 1409 | 337.6 |
| D | 7 | 238 | 1247587 | 3736.89 | 1411 | 1366 | 333.5 |
| D | 1 | 52 | 1181383 | 3538.37 | 1411 | 1366 | 333.5 |
| D | 8 | 230 | 630053 | 1885.17 | 1411 | 1366 | 333.5 |
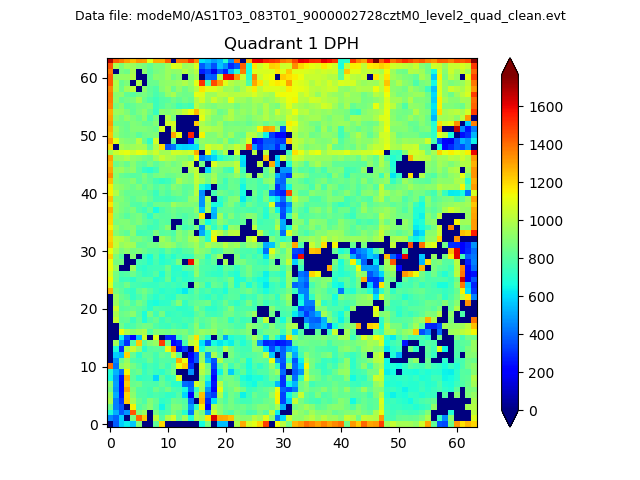
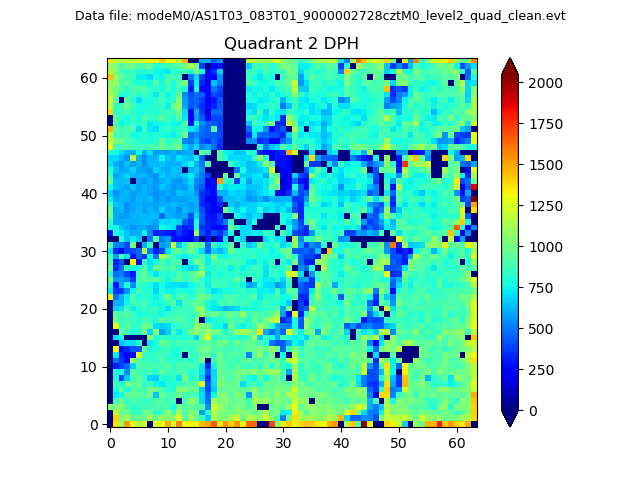
Histogram calculated using DETX and DETY for each event in the final _common_clean file
| Quadrant A |  |
 |
Quadrant B |
|---|---|---|---|
| Quadrant D | 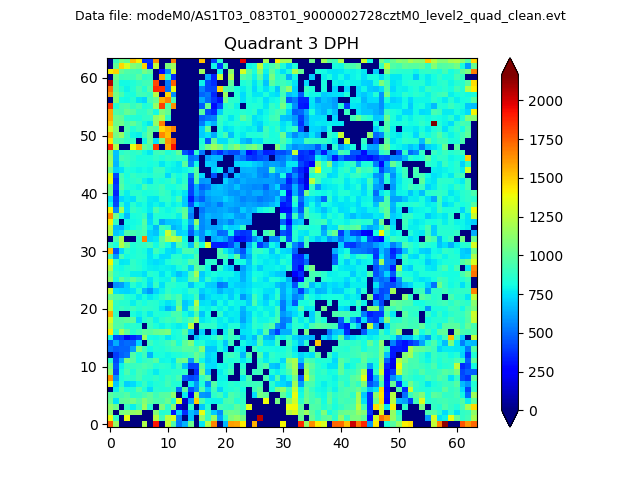 |
 |
Quadrant C |
| Plot type | Count rate plots | Images |
|---|---|---|
| Comparison with Poisson distribution Blue bars denote a histogram of data divided into 1 sec bins. Red curve is a Poisson curve with rate = median count rate of data. |
 |
 |
| Quadrant-wise count rates Data is divided into 100 sec bins |
 |
|
| Module-wise count rates for Quadrant A Data is divided into 100 sec bins |
 |
 |
| Module-wise count rates for Quadrant B Data is divided into 100 sec bins |
 |
 |
| Module-wise count rates for Quadrant C Data is divided into 100 sec bins |
 |
 |
| Module-wise count rates for Quadrant D Data is divided into 100 sec bins |
 |
 |
| Parameter | Plot |
|---|---|
| CZT HV Monitor |  |
| D_VDD |  |
| Temperature 1 |  |
| Veto HV Monitor |  |
| Veto LLD | 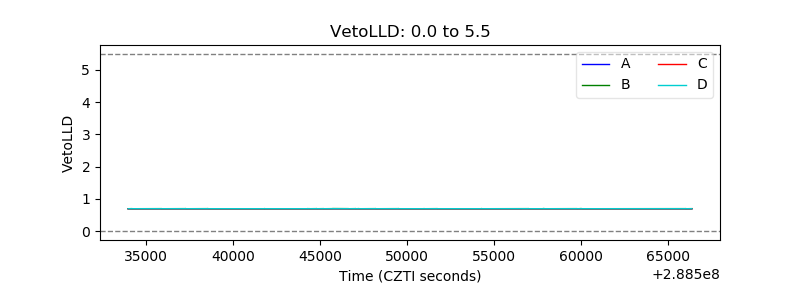 |
| Alpha Counter |  |
| _CPM_Rate |  |
| CZT Counter |  |
| +2.5 Volts monitor |  |
| +5 Volts monitor |  |
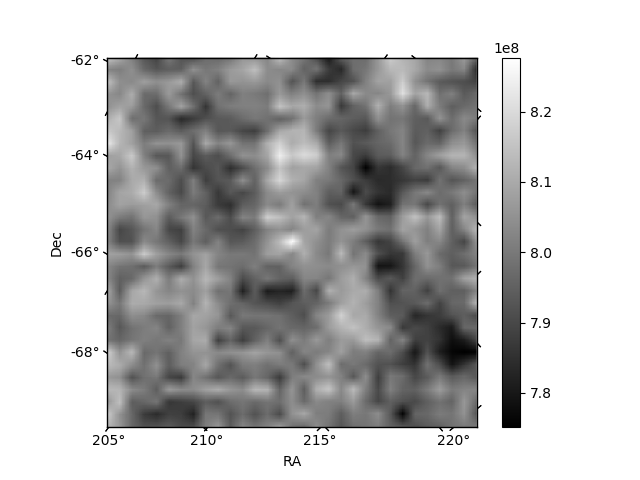
| _ROLL_ROT |  |
| _Roll_DEC | 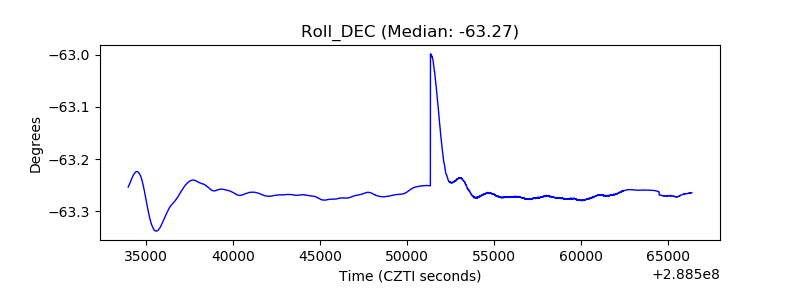 |
| _Roll_RA |  |
| Veto Counter |  |