| Param | Original file | Final file |
|---|---|---|
| Filename | modeM0/AS1A05_094T01_9000002726cztM0_level2_bc.evt | modeM0/AS1A05_094T01_9000002726cztM0_level2_quad_clean.evt |
| Size (bytes) | 2,578,124,160 | 994,276,800 |
| Size | 2.4 GB | 948.2 MB |
| Events in quadrant A | 16,582,132 | 6,399,517 |
| Events in quadrant B | 16,768,555 | 6,496,047 |
| Events in quadrant C | 15,962,466 | 6,121,817 |
| Events in quadrant D | 23,546,247 | 5,851,565 |
| Mode SS | |||
|---|---|---|---|
| Quadrant | BADHDUFLAG | Total packets | Discarded packets |
| A | 0 | 1556 | 0 |
| B | 0 | 1556 | 0 |
| C | 0 | 1556 | 0 |
| D | 0 | 1556 | 0 |
| Mode M9 | |||
|---|---|---|---|
| Quadrant | BADHDUFLAG | Total packets | Discarded packets |
| A | 0 | 119 | 0 |
| B | 0 | 119 | 0 |
| C | 0 | 119 | 0 |
| D | 0 | 119 | 0 |
| Mode M0 | |||
|---|---|---|---|
| Quadrant | BADHDUFLAG | Total packets | Discarded packets |
| A | 0 | 160552 | 0 |
| B | 0 | 161242 | 0 |
| C | 0 | 160119 | 0 |
| D | 0 | 187991 | 0 |
| Quadrant | Total seconds | Saturated seconds | Saturation percentage |
|---|---|---|---|
| A | 76543 | 1141 | 1.490665% |
| B | 76543 | 1281 | 1.673569% |
| C | 76543 | 1527 | 1.994957% |
| D | 76543 | 3854 | 5.035078% |
Noise dominated data is calculated using 1-second bins in cleaned event files. If a bin has >2000 counts, and if more than 50% of those come from <1% of pixels, then it is considered to be noise-dominated and hence unusable.
| Quadrant | # 1 sec bins | Bins with >0 counts | Bins with >2000 counts | High rate bins dominated by noise | Noise dominated (total time) | Noise dominated (detector-on time) | Marked lightcurve |
|---|---|---|---|---|---|---|---|
| A | 88304 | 76547 | 23 | 23 | 0.03% | 0.03% | 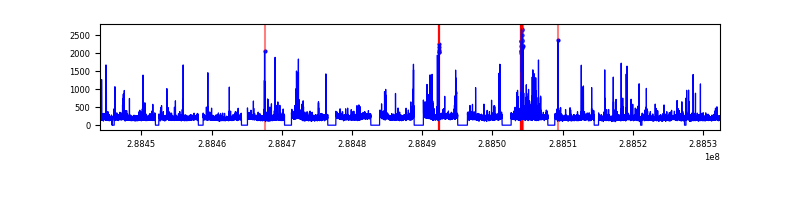 |
| B | 88304 | 76545 | 5 | 5 | 0.01% | 0.01% |  |
| C | 88304 | 76546 | 113 | 113 | 0.13% | 0.15% |  |
| D | 88304 | 76546 | 726 | 726 | 0.82% | 0.95% | 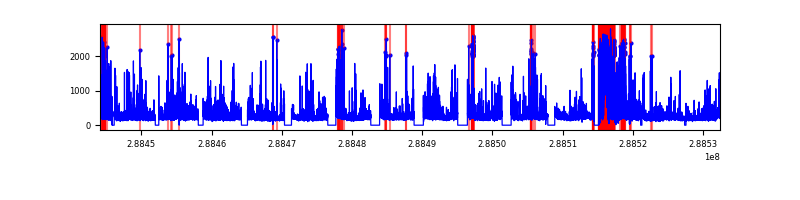 |
Top three noisy pixels from each quadrant. If the there are fewer than three noisy pixels in the level2.evt file, extra rows are filled as -1
| Pixel properties | Quadrant properties | ||||||
|---|---|---|---|---|---|---|---|
| Quadrant | DetID | PixID | Counts | Sigma | Mean | Median | Sigma |
| A | 4 | 2 | 558161 | 631.35 | 3979 | 3896 | 877.9 |
| A | 15 | 174 | 417704 | 471.36 | 3979 | 3896 | 877.9 |
| A | 8 | 34 | 185461 | 206.82 | 3979 | 3896 | 877.9 |
| B | 3 | 64 | 409337 | 532.6 | 4033 | 3930 | 761.2 |
| B | 10 | 245 | 317686 | 412.19 | 4033 | 3930 | 761.2 |
| B | 0 | 189 | 121530 | 154.5 | 4033 | 3930 | 761.2 |
| C | 5 | 112 | 668934 | 735.39 | 3830 | 3810 | 904.4 |
| C | 3 | 233 | 426889 | 467.78 | 3830 | 3810 | 904.4 |
| C | 0 | 207 | 56048 | 57.76 | 3830 | 3810 | 904.4 |
| D | 1 | 52 | 6674581 | 7582.89 | 3788 | 3657 | 879.7 |
| D | 7 | 238 | 774595 | 876.33 | 3788 | 3657 | 879.7 |
| D | 12 | 110 | 408219 | 459.87 | 3788 | 3657 | 879.7 |
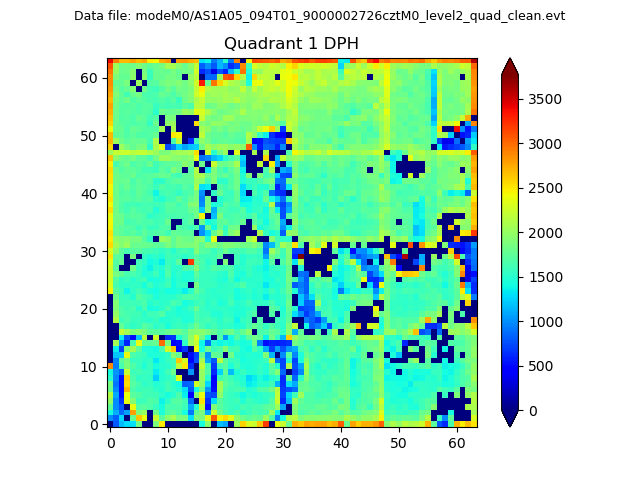
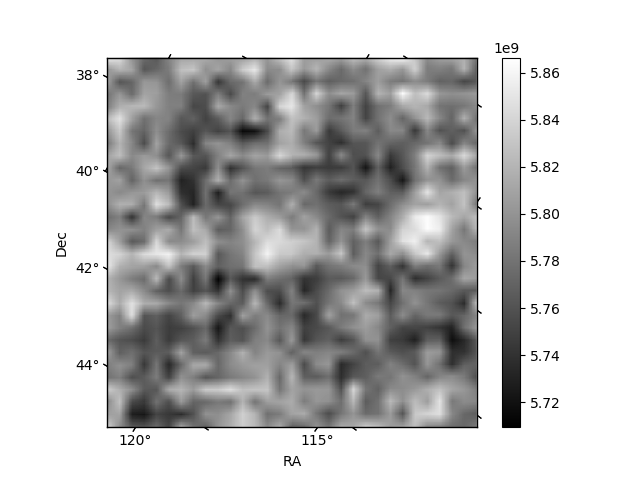
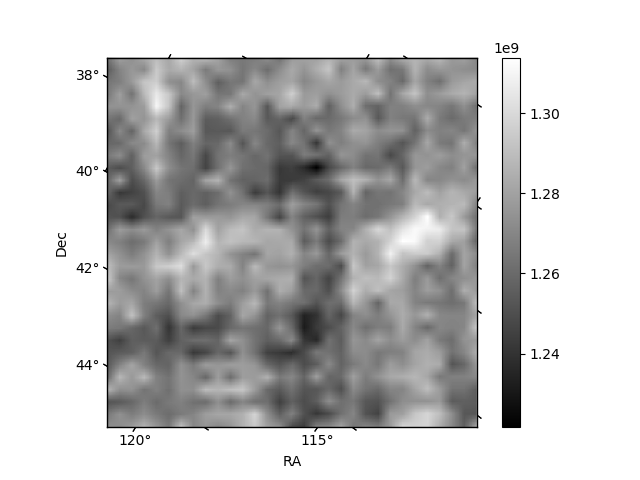
Histogram calculated using DETX and DETY for each event in the final _common_clean file
| Quadrant A |  |
 |
Quadrant B |
|---|---|---|---|
| Quadrant D | 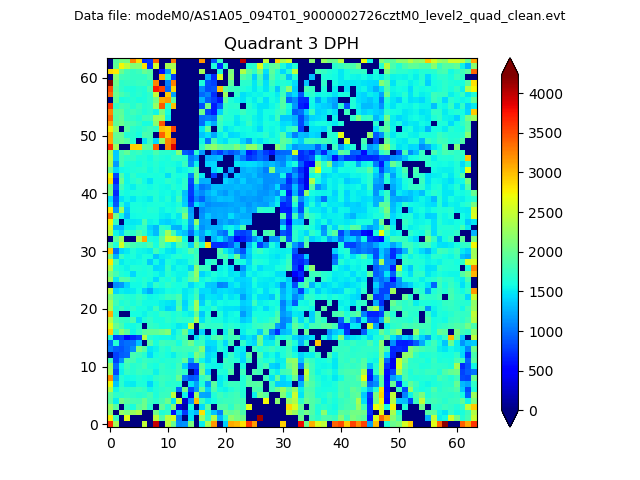 |
 |
Quadrant C |
| Plot type | Count rate plots | Images |
|---|---|---|
| Comparison with Poisson distribution Blue bars denote a histogram of data divided into 1 sec bins. Red curve is a Poisson curve with rate = median count rate of data. |
 |
 |
| Quadrant-wise count rates Data is divided into 100 sec bins |
 |
|
| Module-wise count rates for Quadrant A Data is divided into 100 sec bins |
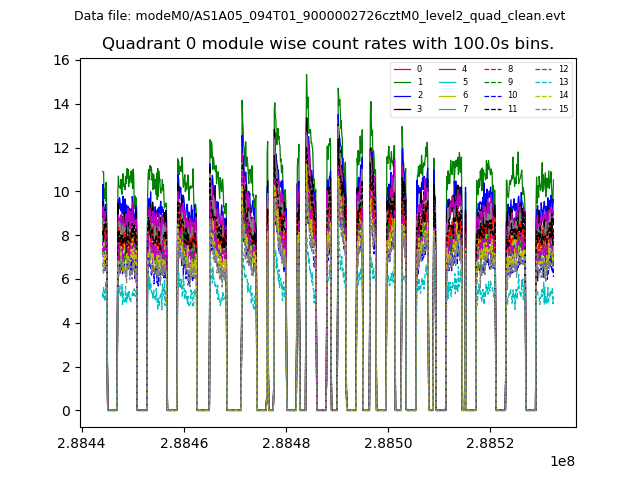 |
 |
| Module-wise count rates for Quadrant B Data is divided into 100 sec bins |
 |
 |
| Module-wise count rates for Quadrant C Data is divided into 100 sec bins |
 |
 |
| Module-wise count rates for Quadrant D Data is divided into 100 sec bins |
 |
 |
| Parameter | Plot |
|---|---|
| CZT HV Monitor |  |
| D_VDD |  |
| Temperature 1 |  |
| Veto HV Monitor |  |
| Veto LLD | 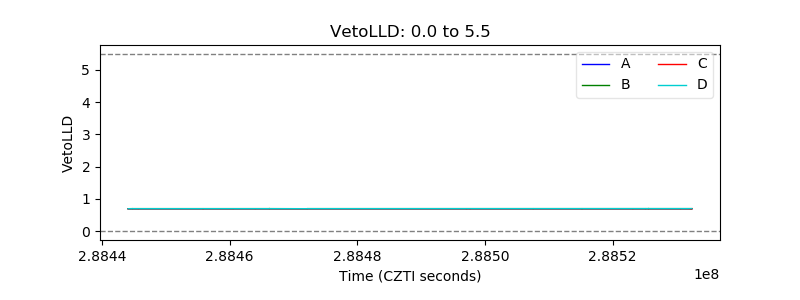 |
| Alpha Counter |  |
| _CPM_Rate |  |
| CZT Counter |  |
| +2.5 Volts monitor |  |
| +5 Volts monitor |  |
| _ROLL_ROT |  |
| _Roll_DEC |  |
| _Roll_RA |  |
| Veto Counter |  |